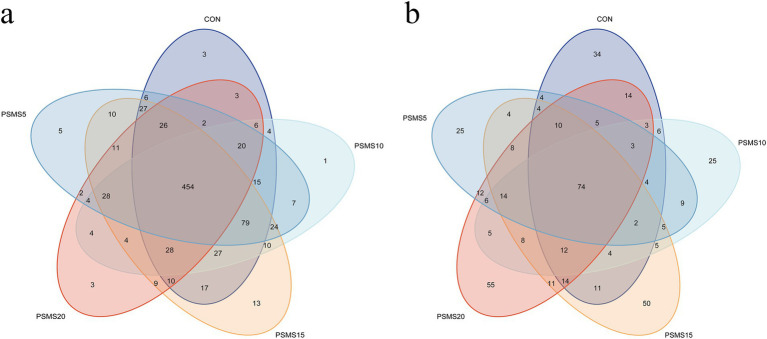
Figure 3.
Venn diagram of OTUs in (a) rumen bacteria and (b) fungi of Hu sheep. The different colors of the ellipses in the Venn diagram represent different groups, and the overlapping regions indicate the number of shared features among the groups. The non-overlapping regions represent the number of features specific to each group. P.SMS replaced WPCS at levels of 0%, CON; 5%, PSMS5; 10%, PSMS10; 15%, PSMS15; or 20%, PSMS20.

