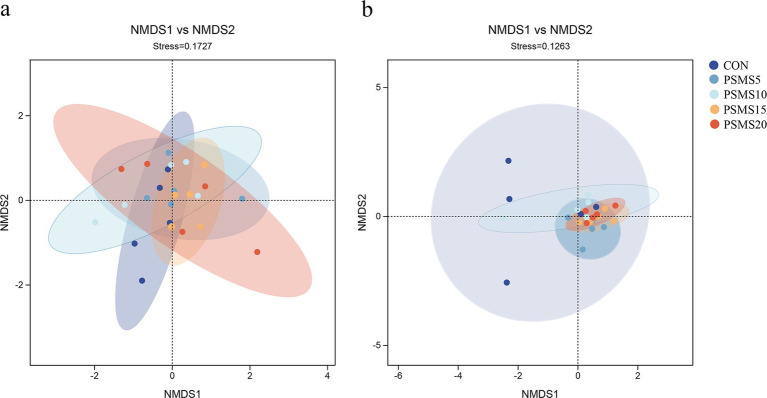
Figure 4.
NMDS analysis of (a) rumen bacteria and (b) fungi of Hu sheep. Each point in the figure represents a sample; different colors represent different subgroups; the oval circle indicates that it was a 95% confidence ellipse. When Stress is less than 0.2, it indicates that the NMDS analysis has some reliability. The closer the samples are to each other on the coordinate graph, the higher the similarity. P.SMS replaced WPCS at levels of 0%, CON; 5%, PSMS5; 10%, PSMS10; 15%, PSMS15; or 20%, PSMS20.

