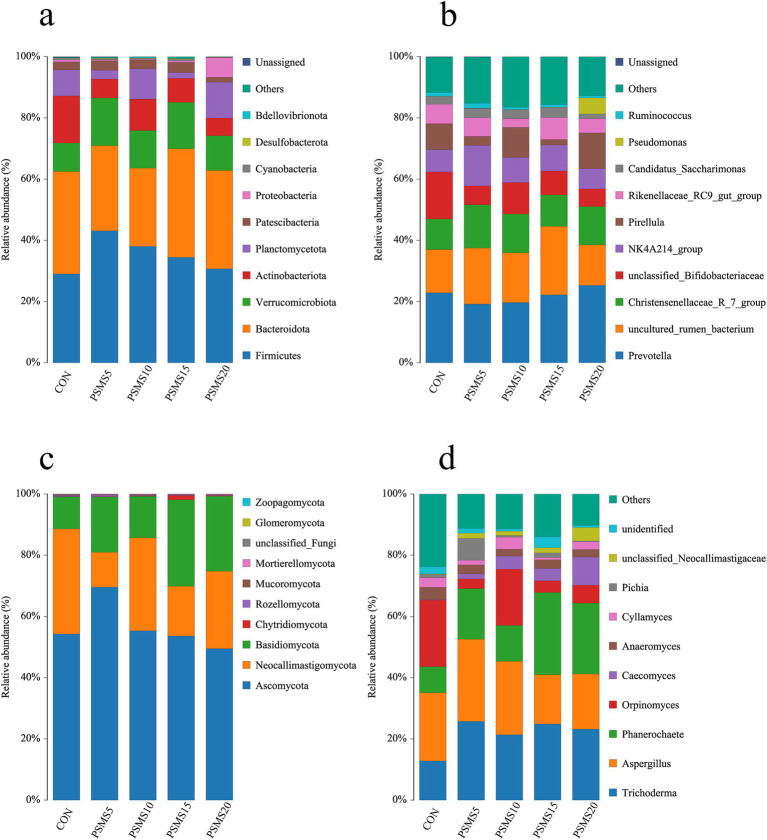
Figure 5.
The relative abundance of ruminal bacteria at the level of (a) phylum and (b) genus. The relative abundance of ruminal fungi at the level of (c) phylum and (d) genus. The horizontal axis in the figure represents group names, and the vertical axis represents relative abundance percentages. Different colors represent different species, and stacked bars indicate the top 10 taxonomic groups of relative abundance at each classification level. P.SMS replaced WPCS at levels of 0%, CON; 5%, PSMS5; 10%, PSMS10; 15%, PSMS15; or 20%, PSMS20.

