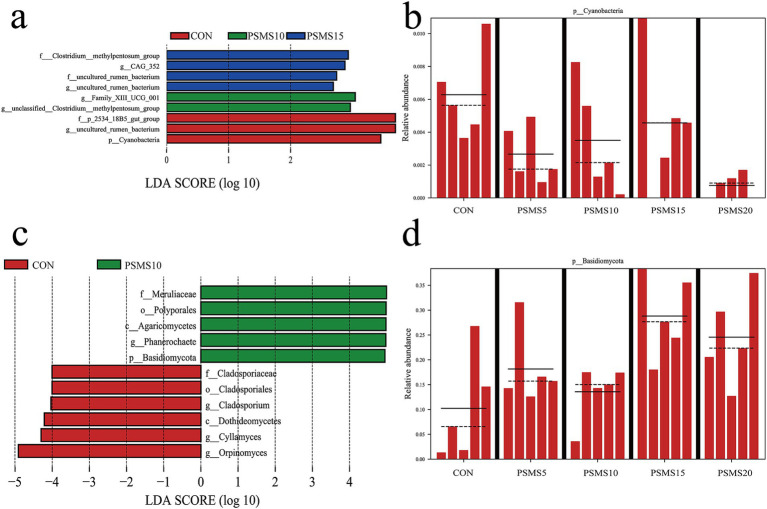
Figure 6.
LEfSe analysis of rumen bacteria and fungi. Linear discriminant analysis effect size cladogram based on classification of (a) rumen bacteria and (c) fungi. Comparison of the relative abundance of (b) bacterial and (d) fungal biomarkers at the phylum level between five groups. P.SMS replaced WPCS at levels of 0%, CON; 5%, PSMS5; 10%, PSMS10; 15%, PSMS15; or 20%, PSMS20.

