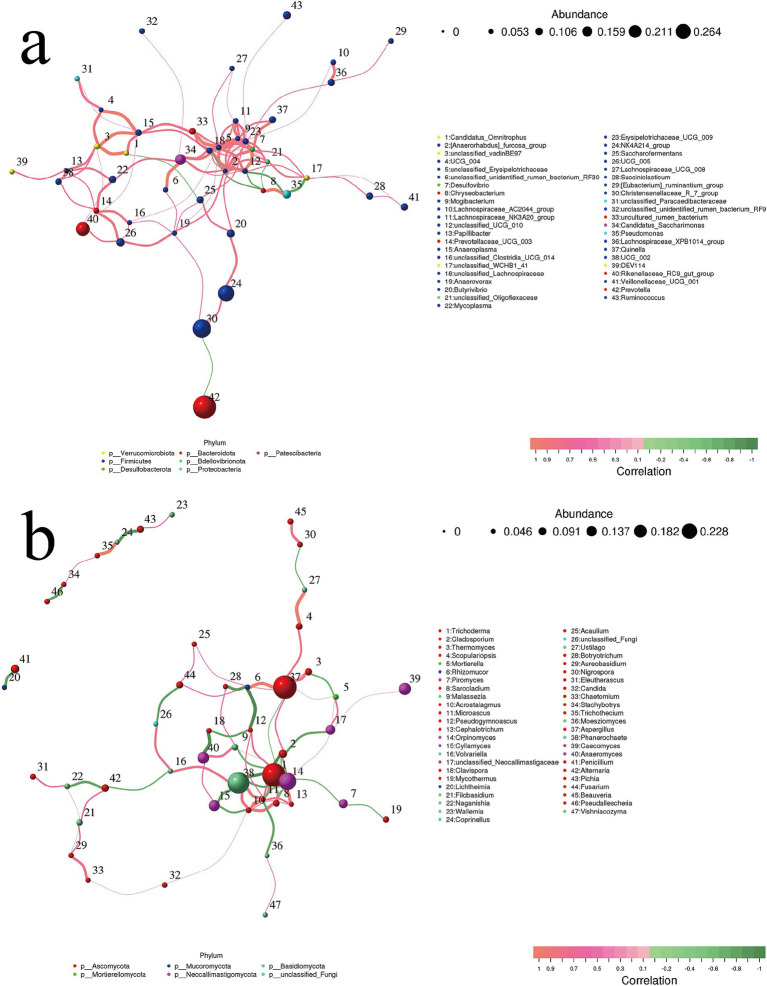
Figure 7.
Correlation network of top 50 genera for (a) rumen bacteria and (b) fungi. Species are represented by circles, where the size of each circle indicates the abundance of the species. Furthermore, different colors are used to denote distinct phylum classifications. Edges represent the correlation between two species, with line thickness indicating strength and line color indicating correlation direction: orange for positive correlation and green for negative correlation. P.SMS replaced WPCS at levels of 0%, CON; 5%, PSMS5; 10%, PSMS10; 15%, PSMS15; or 20%, PSMS20.

