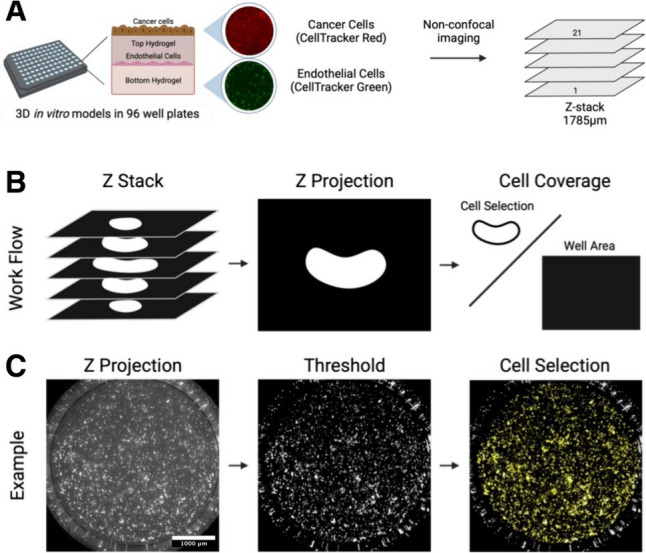
Fig. 1.

Schematic representation of image acquisition and cell thresholding. A CellTracker Green labeled human microvascular endothelial cells (hMVEC) were cocultured in different 3D in vitro hydrogel models with CellTracker Red labeled cancer cells (SiHa, CaSki, or HEC-1A). Constructs were imaged every three h for 48 h with two different channels (GFP and Texas Red) and a 1785 µm Z-stack was taken for each well to capture full construct height. B Schematic demonstrating Z-projection followed by cell coverage calculation C Example of how Z-projection images are used to calculate cell coverage.
