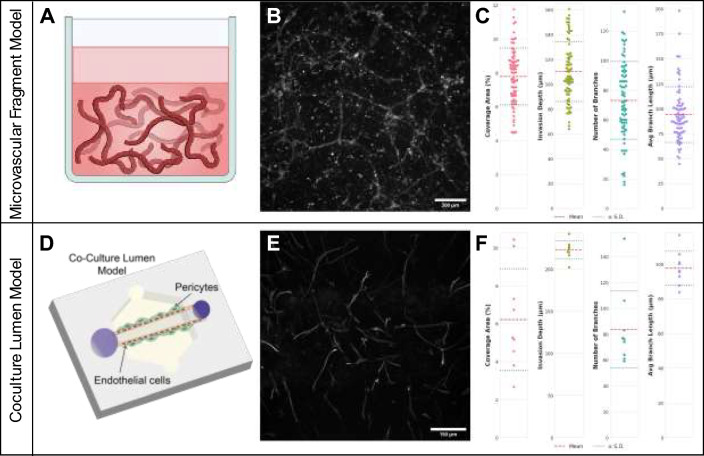
Fig. 10.
Automated analysis of lumen and microvascular fragment coculture microphysiological models. A Schematic of microvascular fragments in a Col1 hydrogel. B Representative maximum intensity projection of a z-stack image from a microvascular fragment model. Scale bar represents 200 μm. C Quantitative measurements of cell coverage area, invasion depth, number of microvessel branches, and average microvessel branch length from the microvascular fragment model dataset (n = 72 z-stacks). D Schematic of coculture lumen model with pericytes and endothelial cells in a Col1 hydrogel. E Representative maximum intensity projection of a Z-stack image from a coculture lumen model showing hCMEC/d3 cells and human brain vascular pericytes stained for actin filaments. Scale bar represents 150 μm. F Quantitative measurements of coverage area, invasion depth, number of microvessel branches, and average microvessel branch length for the coculture lumen dataset (n = 9 Z-stacks). In B and D, each dot represents a measurement from a single Z-stack, red dashed lines indicate mean values, and blue dotted lines show ± standard deviation.

