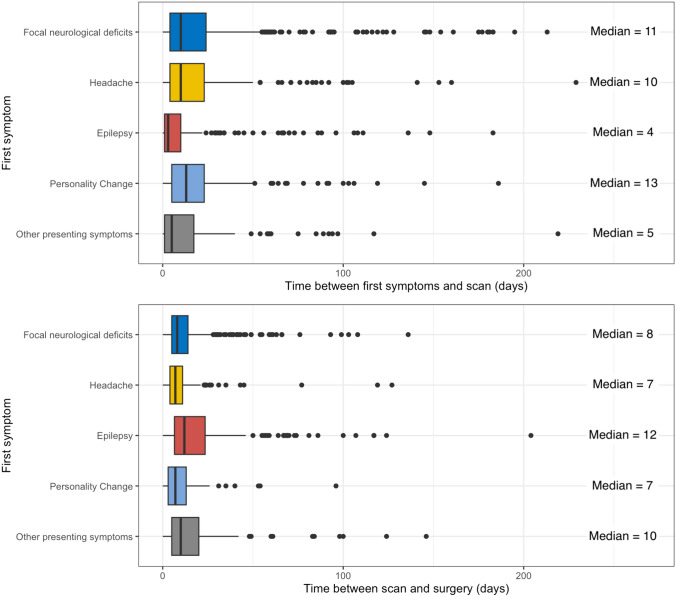
Fig. 2.
Clinical time intervals. A (upper figure) Time between first symptoms and scan. Boxplots show the distribution of time intervals (in days) between different types of first symptoms and first diagnostic scan with MRI. Median values vary between symptom categories (shortest interval in epileptic patients, longest interval in patients with personality changes). B (lower figure) Time between scan and surgery. Boxplots as previously described for distribution of time intervals (in days) between first diagnostic scan and first resection. Median values show the shortest interval in patients with personality changes, and the longest interval in epileptic patients (vice versa to A)

