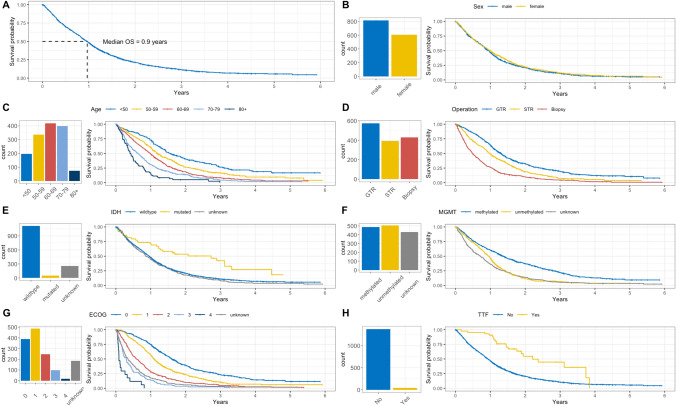
Fig. 4.
Results of univariate survival analyses. Kaplan–Meier plots showing overall survival A as well as analyses of specific prognostic factors (B-H). Kaplan–Meier plots are accompanied by bar charts showing numbers of patients in different categories. B Sex: there is no sex difference with regard to outcome. C Age: there is a clear indirect correlation: young patients show a significantly more favorable outcome as compared to elderly patients. D Extent of resection: there is a direct correlation: patients with gross-total/subtotal resection survive significantly better than patients with biopsy only. E IDH-status: significantly better survival in IDH-mutated cases. F MGMT-promoter-methylation: significantly better survival in cases with MGMT-promoter methylation. G ECOG score: there is a clear indirect correlation: patients with a low postoperative ECOG score survive significantly better as compared to patients with a high ECOG score. H Tumor treating fields (TTF) therapy: the small group of patients who received TTF-therapy show a significantly better outcome

