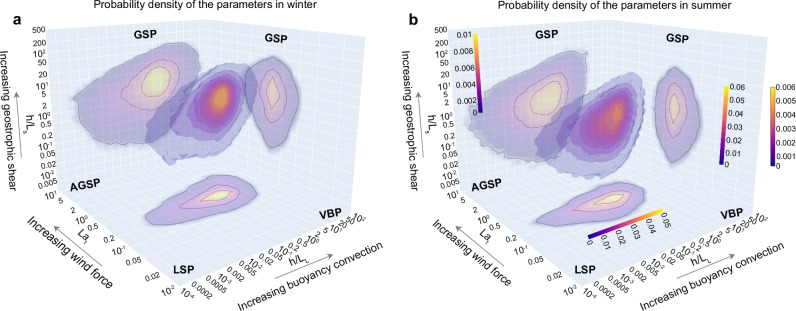
Fig. 1. Three-dimensional global probability density of the three parameters.
a The probability density in winter. b The probability density in summer. The three parameters are turbulent Langmuir number Lat of the x-axis, the ratio of the boundary layer depth to the Langmuir stability length h/LL of the y-axis, and the ratio of the boundary layer depth to the geostrophic shear stability length h/Ls of the z-axis. Two-dimensional projections of the distributions are also shown. The black contours enclose 30%, 60%, and 90% of the global values. Each source of turbulence is labeled (GSP: geostrophic shear production turbulence; LSP Langmuir shear production turbulence, VBP vertical buoyancy production turbulence, AGSP ageostrophic shear production turbulence) and the contribution of fronts (i.e., GSP) is highlighted as the geostrophic shear along the z-axis is increased.

