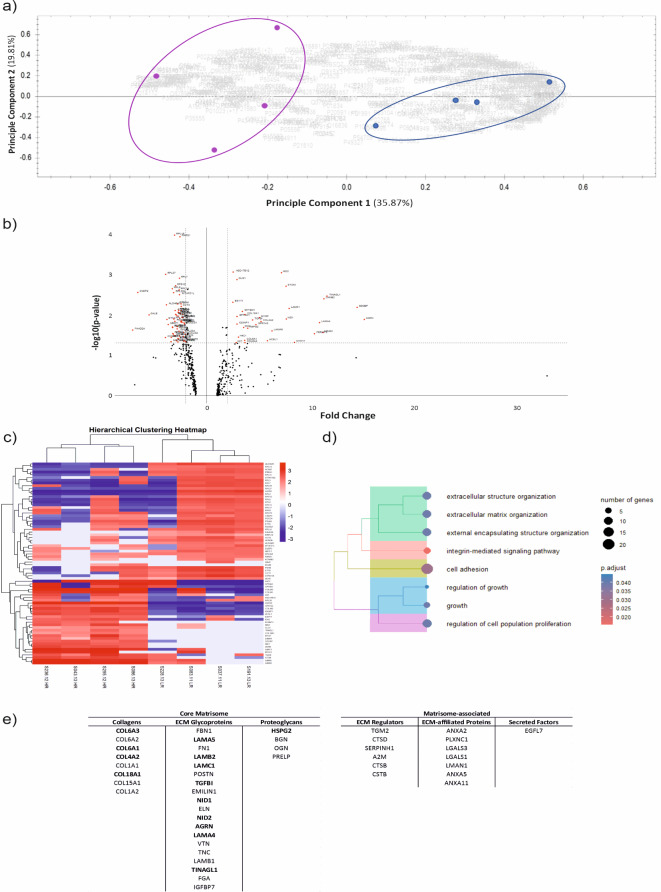
Fig. 2.
Proteomic analysis of decellularised pUM. (a) PCA of 488 proteins identified by LC-MS from decellularised LR-D3 (blue, n = 4) and HR-M3 (purple, n = 4) pUM samples; (b) Volcano plot of differentially expressed proteins with FC ≥ 2, including 93 labelled proteins with P < 0.05 (red) Supplementary Table S1 ; (c) Hierarchical clustering of pUM samples for the significant 93 proteins (d) Tree plot of enriched GO terms for all proteins highlighting ECM pathways; (e) 45 proteins identified as ECM-associated using matrisome database 2.0 represented using ECM classifications.

