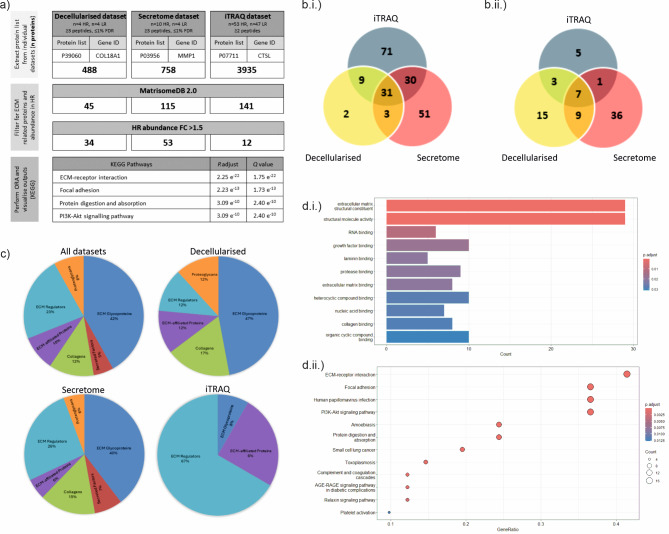
Fig. 3.
Bioinformatic analysis of in-house datasets (decellularised, secretome, iTRAQ). (a) Bioinformatic pipeline of proteomic data processing, and filtering results by HR-M3 metastatic status on the Homo sapiens MatrisomeDB 2.0 background with P < 0.05 (in bold are protein hits after each analysis step); (b) Venn diagrams reflecting the overlap of proteins from each dataset (i) 197 genes used for ORA, (ii) 76 genes upregulated in HR FC ≥ 1.5; (c) Proportion of proteins from 76 genes classified by matrisome nomenclature for combined datasets (All) and separately (decellularised, secretome, iTRAQ) - sub-categories include core matrisome ECM glycoproteins, collagens, proteoglycans and matrisome-associated secreted factors, ECM-affiliated proteins, ECM regulators; & (d) ORA pathways showing (i) GO pathways from MF classification, (ii) KEGG pathways22–24.

