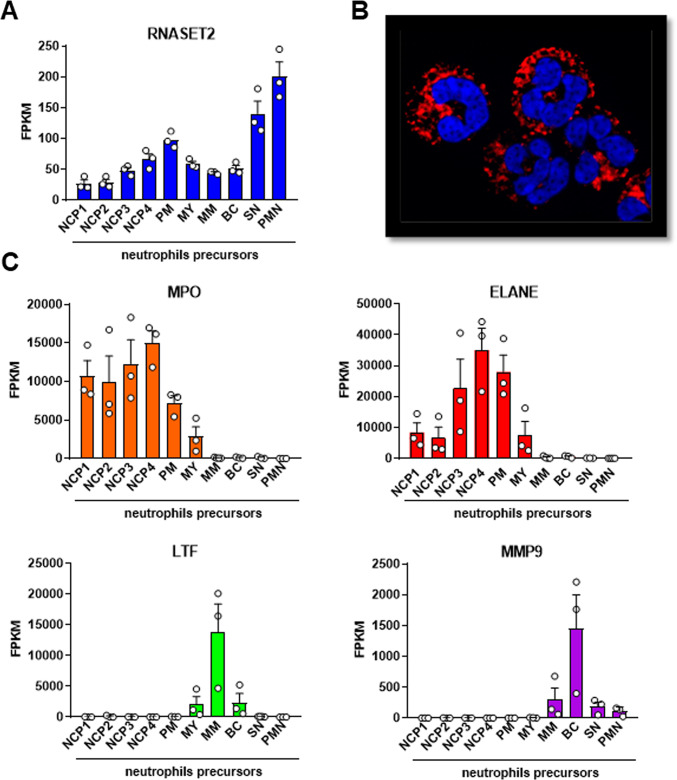
Fig. 1.
Transcriptomic analysis and intracellular localization of RNASET2 in human neutrophils – RNAseq analysis of (A) RNASET2 and (C) selected neutrophil granule proteins (MPO, ELANE, LTF, and MMP9) transcript levels in Neutrophil Committed Precursors (NCP)1, NCP2, NCP3, NCP4, promyelocyte (PM), myelocytes (MY), metamyelocyte (MM), Band cells (BC), Segmented Neutrophils (SN) and circulating blood-derived neutrophil (PMN). Values represent the mean ± SEM of FPKM (Fragments Per Kilobase per Million mapped fragments). (B) Representative immunofluorescence image of human neutrophils showing RNASET2 reactivity (red) and nuclei staining with DAPI (blue). Magnification, 1000x.

