Fig. 5.
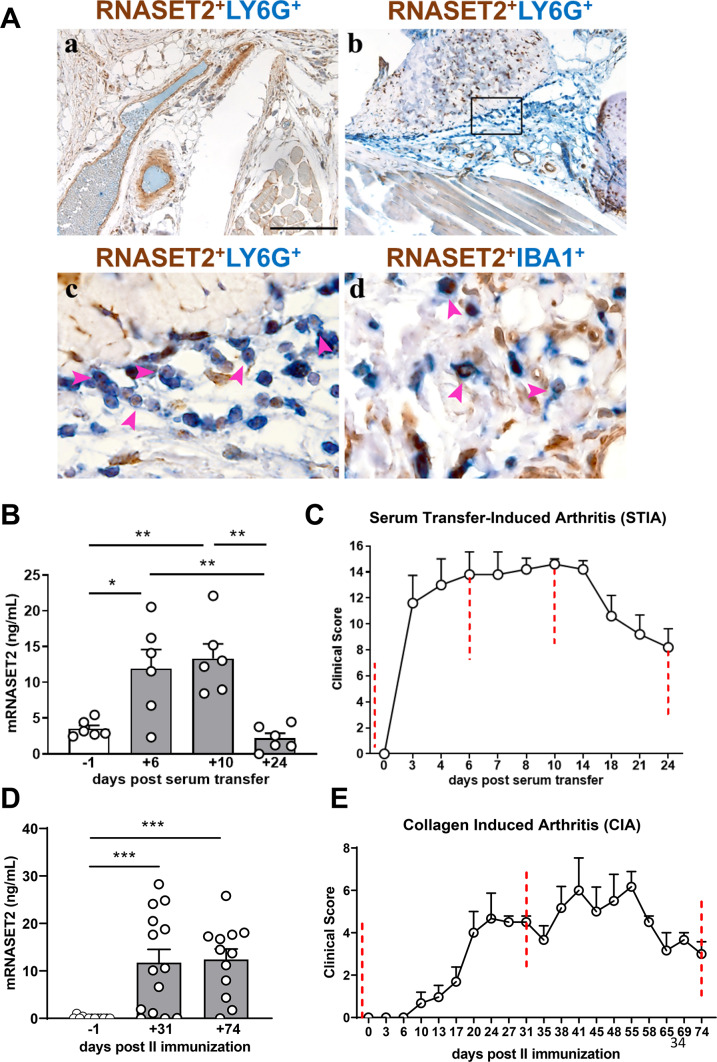
RNASET2 expression in murine models of experimental arthritis – (A) Representative FFPE joint samples of control (a) and STIA-induced mouse (b-d) showing lack of infiltrating cells and abundant neutrophils infiltration, respectively. Double staining of RNASET2 expression in Ly6G+ neutrophils (c) and IBA1+ macrophages (d). Magnification 100x, scale bar 200 μm (a-b); 600x, scale bar 33 μm (c-d). (B) Serum levels of mouse RNASET2 evaluated at different time points of STIA progression. *p < 0.05 day + 6 vs. day − 1, respectively; **p < 0.01, day + 6 and day + 10 vs. day + 24, by one-way ANOVA. *p < 0.05, day + 6 vs. day − 1, **p < 0.01 day + 10 vs. day − 1, and day + 6 vs. day + 24, and day + 10 vs. day + 24, by one-way ANOVA. Data are shown as mean ± SEM (n = 6 mice/group) of one representative experiment out of three. (C) Clinical score of STIA, induced by injection of 150 µL of K/BxN serum in C57BL/6J mice at day 0 (n = 6 mice/group). Scores from 4 paws were combined for each mouse, and total severity score for the group was divided by the number of arthritic mice to obtain an average severity score (clinical score, 0–16 in the 4 paws). (D) Serum levels of mouse RNASET2 evaluated at different time points of CIA progression. *** p < 0.001, day + 31 vs. day − 1, and day + 74 vs. day-1, by one-way ANOVA. (E) Clinical score of CIA in DBA1 mice immunized with bovine type II collagen. Scores from 4 paws were combined for each mouse, and total severity score for the group was divided by the number of arthritic mice to obtain an average severity score (clinical score, 0–16 in the 4 paws). Data are shown as mean ± SEM (n = 12–14 mice/group) of one representative experiment out of two.

