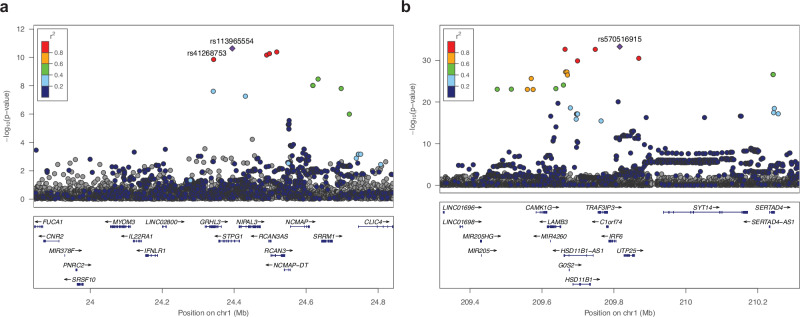
Fig. 2. Regional association plots of the chromosome 1 risk loci for non-syndromic CP.
Data are shown for association on chromosome (a) 1p36.1 (GRHL3) and (b) 1q32.2 (IRF6). Negative log10 P values ( y axis) are shown for variants (x axis) within a 1 Mb region centered at the reference SNP. Two-sided P values are obtained from a likelihood ratio test in regression analysis and are not corrected for multiple comparisons. The reference SNP is marked with a purple diamond, and pairwise LD (r 2) between the reference SNP and other variants are indicated by color. The r 2 values were estimated from high-coverage whole-genome sequences of 3775 Finns. Both directly genotyped and imputed SNPs are plotted. Genomic coordinates are shown according to the human genome build GRCh38/hg38.

