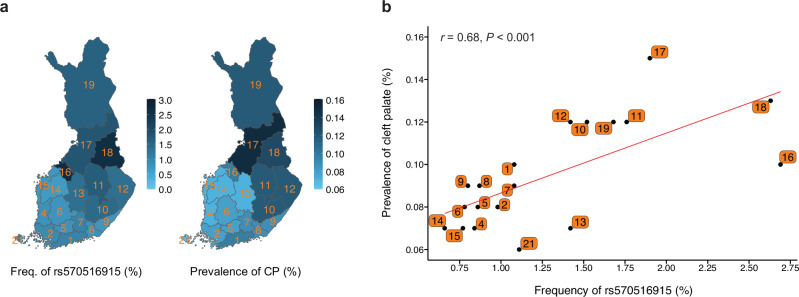
Fig. 3. Geographic distribution and correlation of the rs570516915 variant allele frequency with regional prevalence of non-syndromic CP in Finland.
a Distribution of the rs570516915 G allele frequency and CP prevalence in 19 administrative regions of Finland. The variation in allele frequency and CP prevalence across distinct regions are illustrated by the intensity of the blue shading. Regions are labeled by their corresponding codes from Statistics Finland and shown in Supplementary Data 8. b Correlation between the regional allele frequency of rs570516915 and prevalence of CP. Allele frequency was estimated using birthplace data of 306,678 FinnGen study participants. Regional CP prevalences were estimated using nationwide data on the first recorded addresses and CP related diagnosis codes of 5,216,731 individuals (5162 with CP). Red line represents the ordinary least squares regression line. Pearson’s r and P value (two-sided) shown at the top of the plot indicate the strength and statistical significance of correlation. See Supplementary Data 8 for raw numbers.

