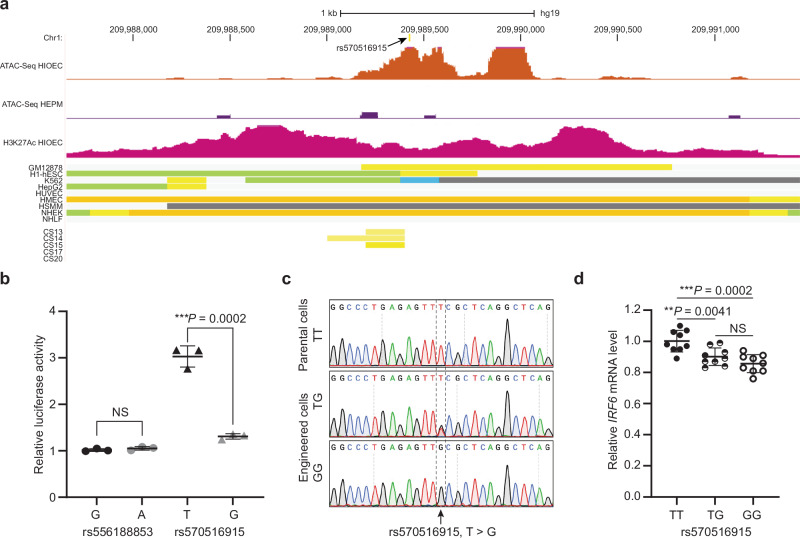
Fig. 4. The rs570516915 variant reduces enhancer activity of MCS-9.7.
a Browser view of the human genome, GRCh37/hg19, focused on the rs570516915 variant. Top two tracks represent open chromatin peaks detected by ATAC-Seq in HIOEC and HEPM cells, respectively. Next track shows H3K27Ac marks illustrating rs570516915 as a part of enhancer element. Following color coded bars represent chromatin status revealed by ChIP-Seq to various chromatin marks from the ENCODE Project cell lines and facial explants from human embryos at Carnegie stage (CS) 13–20 where orange and yellow bars represent the active and weak enhancer element, respectively; blue, insulator; light green, weak transcribed; gray, Polycomb repressed; light gray, heterochromatin/repetitive; GM12878, B-cell derived cell line; ESC, embryonic stem cells; K562, myelogenous leukemia; HepG2, liver cancer; HUVEC, human umbilical vein endothelial cells; HMEC, human mammary epithelial cells; HSMM, human skeletal muscle myoblasts; NHEK, normal human epidermal keratinocytes; NHLF, normal human lung fibroblasts, CS13-CS20 are facial explants from human embryos. b Scattered dot plot of relative luciferase activity for non-risk and risk alleles of rs556188853 and rs570516915 in HEKn cells. Data are represented as mean values +/− s.d. from three independent experiments. Statistical significance is determined by Student’s t test. P value (two-tailed) is indicated on the plot and NS represents non-significant (P = 0.2452). c Chromatograms illustrating the three genotypes (TT, TG and GG) of rs570516915 in iPSCs generated by CRISPR-Cas9 mediated homology-directed repair. d Scattered dot plot of relative levels of IRF6 mRNA in edited vs parental iOECs assessed by qRT-PCR. Expression levels of IRF6 are normalized against ACTB, GAPDH, HPRT, UBC and CDH1. Data are represented as mean values +/− s.d. from nine replicates of cells harboring each genotype, as indicated in the plot. Statistical significance is determined by Student’s t test (two-tailed). NS represents non-significant (P = 0.1212).

