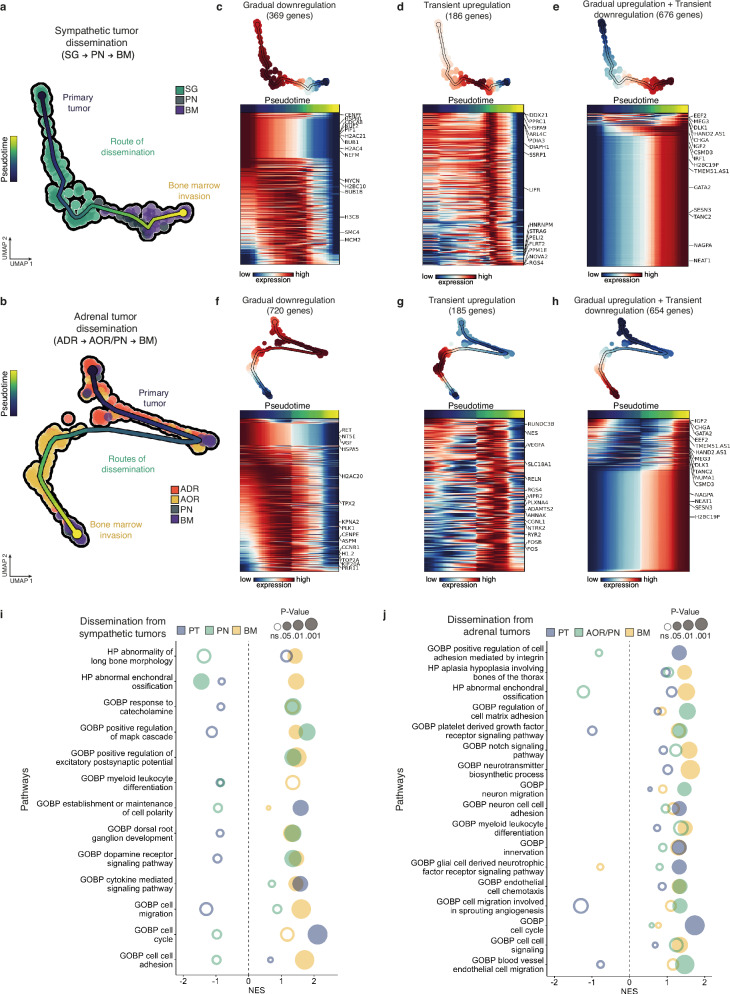
Fig. 6. Dynamic transcriptomic adaptations of NB cells across their dissemination in avian embryonic tissues.
a, b UMAP plots based on the integration of both variant allele frequency and transcriptomic single cell data to map the trajectory of NB cells disseminating from a sympathetic ganglia (a,122 cells) or an adrenal (b, 200 cells) primary tumor site to the bone marrow (BM) via the peripheral nerves (PN) and/or the aorta (AOR). Each trajectory was determined using parsimony tree extracted from cell-to-cell genetic divergence clustering. c–h Sets of genes -and corresponding heatmaps- which expression significantly changes along linear pseudotime of NB cell trajectories using Moran’s I test. Genes following the same type of dynamics (gradual downregulation, transient upregulation, gradual upregulation and transient downregulation) were grouped in independent heatmaps. i, j Gene set enrichment analysis (GSEA) from genes listed to be dynamically regulated in NB cell trajectories from the primary tumor sites to the bone marrow. Pathways were generated with ontology gene sets of molecular signature database (nperm = 1000, ranked by dispersions, abs(NES) > 1.3). Fischer’s exact test was performed. Source data are provided as a source data file.

