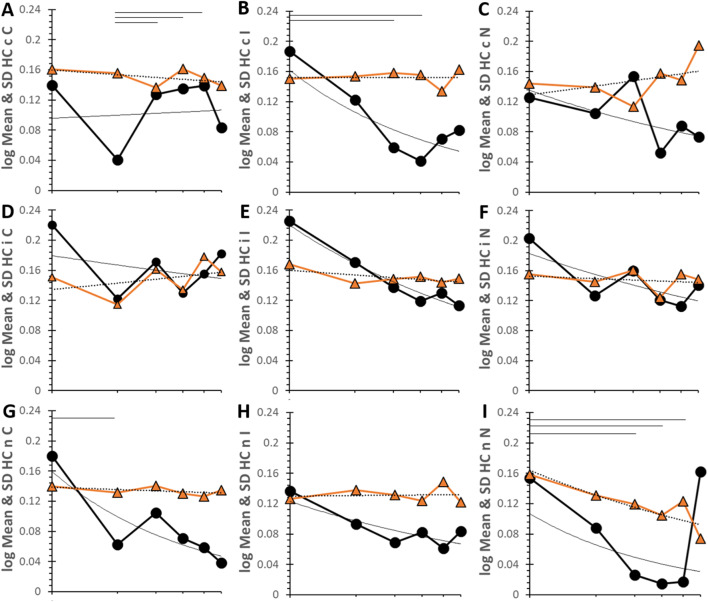
Figure 6.
Log log time series for HC. Time courses are plotted for each pairing with log of mean and SD on the y-axis and log of bin on the x-axis. The top of the y-axis was 0.24s for HC. The six bins corresponded to 162s (21.5 stimuli), 294s (39.2 stimuli), 427s (56.9 stimuli), 563s (75.0 stimuli), 694s (92.5 stimuli) and 900s (120 stimuli). The mean (black circles, black line), SD (orange triangles and line) and power regression curves for mean (black line) and SD (dashed black line) were shown. Lines at the top of each graph indicate significant differences between means for time points (p < 0.05) in the univariate model. Data are in SOM Table S15.

