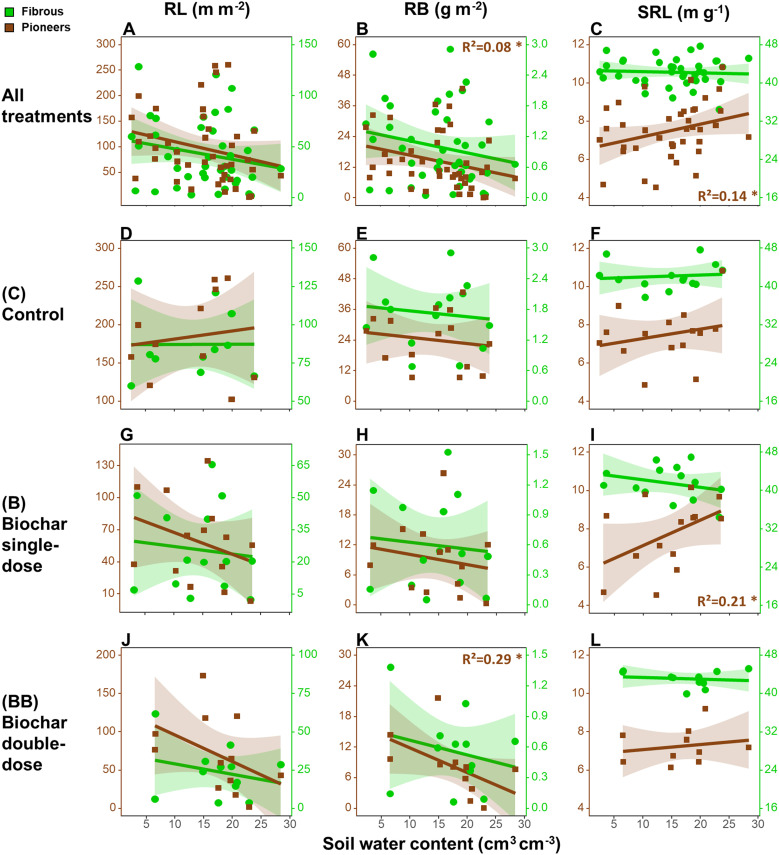
Figure 1.
Relationships between root length (RL, A, D, G, J), root biomass (RB; B, E, H, K), specific root length (SRL; C, F, I, L) in the upper 20 cm soil depth and the seasonal variation of soil water content considering all treatments together (A–C), or only in the control (D–F), biochar single-dose (G–I) and double-dose (J–L) plots in the period between 15th May 2019 and 15th April 2020. The determination coefficient (R²) of the linear regression models is reported only when significant. Legend: *p<0.05. Number of observations in each regression = 48.

