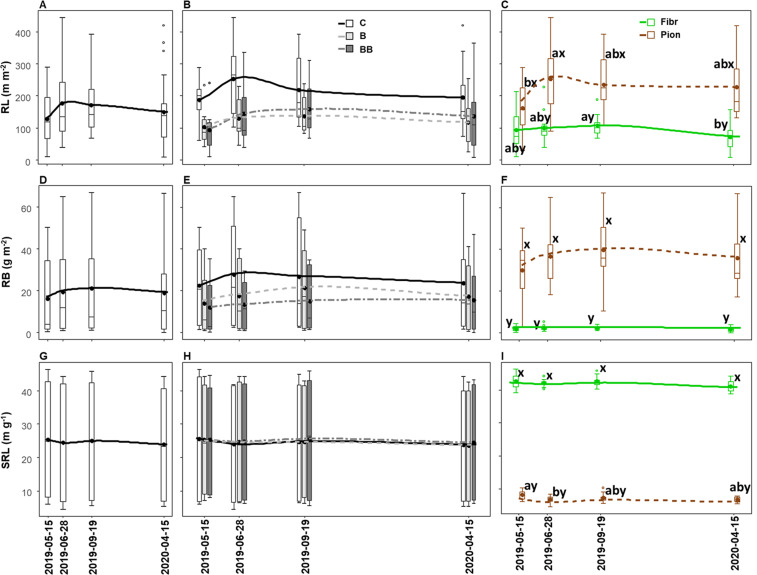
Figure 6.
Seasonal variation of root length (RL; A-C), root biomass (RB; D-F), and specific root length (SRL; G-I) in the upper 40 cm soil depth in relation to sampling date (A, D, G), sampling date x different experimental treatments (control, C; biochar single-dose, B; biochar double-dose, BB) (B, E, H) and sampling date x fine root types (fibrous, Fibr; pioneers, Pion) (C, F, I). The boxplot indicates the median and the mean (respectively, line and circle in the middle of the boxes), the interquartile range (boxes), 1.5 times the interquartile range (whiskers) and outliers (circle). Letters a and b indicate significant differences (p < 0.05) among sampling dates. Letters x and y indicate significant differences (p < 0.05) between fine root types. Number of observations = 96.

