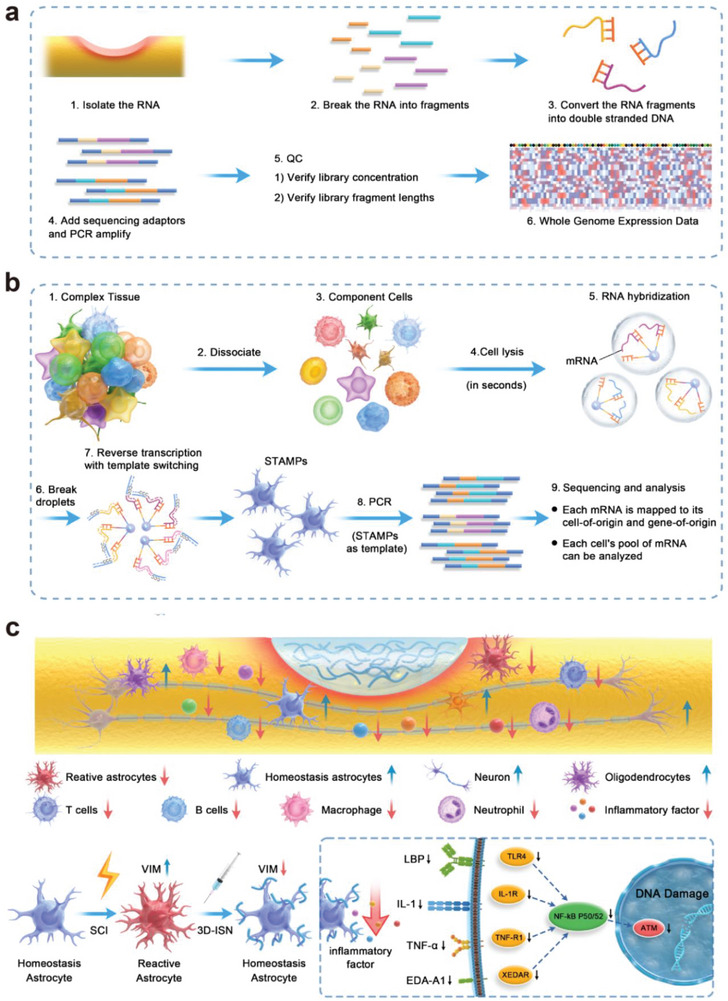
Figure 1.

Schematic diagram of the experimental process. a) Whole transcriptome analysis of spinal cord neural tissue after injury. b) Single‐cell sequencing analysis of gene expression in astrocytes. c) Schematic diagram of the chain of mechanisms by which 3D short fibers constrain the spatial expansion of astrocytes.
