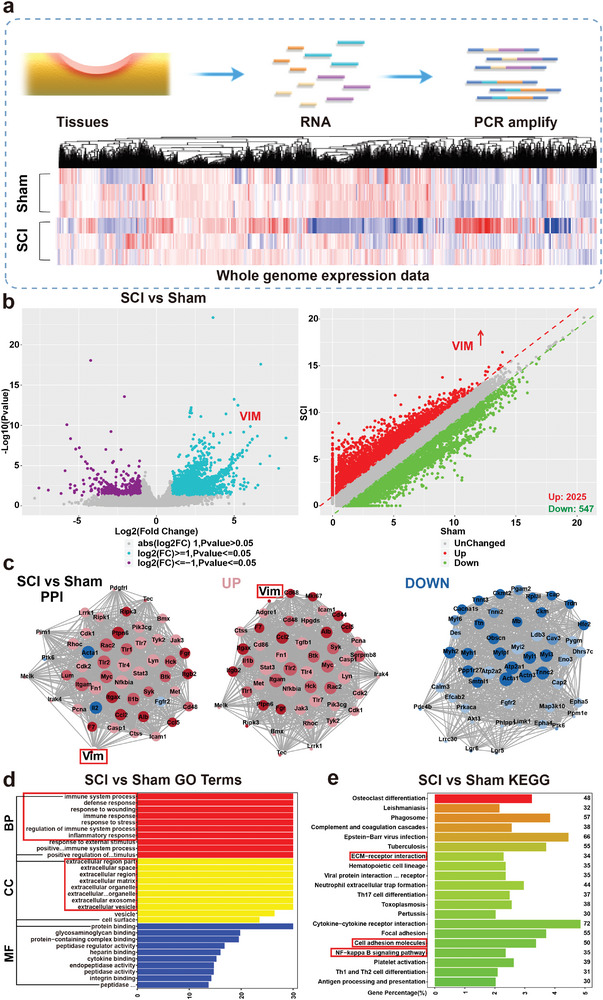
Figure 2.

Transcriptome analysis of spinal cord compression injury in mice. a) Heat map analysis of whole expressed genes of the Sham group and SCI group. b) Volcano map and scatter plot analysis of Differentially Expressed Genes (DEGs) between the SCI group and Sham group. c) Protein–protein interaction network (PPI) analysis of the Sham group compared to the SCI group. Red represents upregulated proteins and blue represents down‐regulated proteins. d) Gene Ontology (GO) terms of the SCI group compared to the Sham group. e) Top 20 enriched Kyoto Encyclopedia of Genes and Genomes (KEGG) pathways up/downregulated in the SCI group compared to the Sham group (N = 3 in each group).
