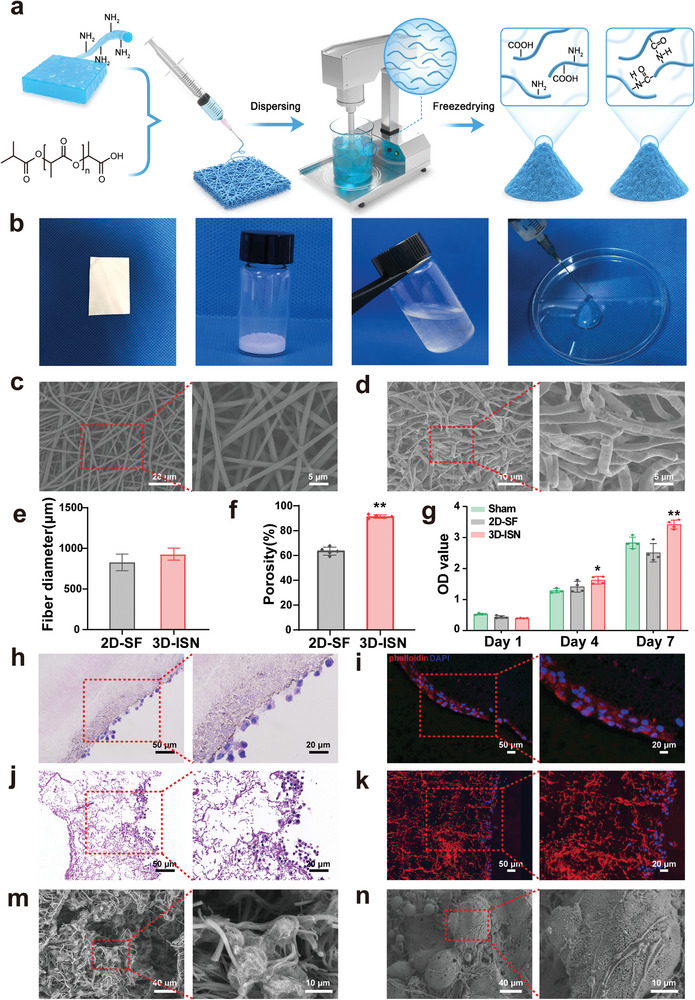
Figure 3.

Preparation and Characterization of 3D electrospun short fibers. a) Schematic representation of the preparations with 2D‐SF and 3D‐ISN. b) Macroscopic images of 2D‐SF and 3D‐ISN. c,d) SEM of 2D‐SF and 3D‐ISN. e) Fiber diameters of 2D‐SF and 3D‐ISN. f) Porosity of 2D‐SF and 3D‐ISN. g) CCK8 results of neuroglia cells co‐cultured with 2D‐SF and 3D‐ISN at different time points. (Data presented as mean ± SEM, N = 3 in each group, P‐values are calculated using one‐way ANOVA, *p < 0.05, **p < 0.01.) h–k) Hematoxylin & Eosin (HE) staining and immunofluorescence staining after co‐culturing neuroglial cells with 2D‐SF and 3D‐ISN for 7 days. m,n) SEM images of neuroglial cells and neural stem cells within the 3D ISN.
