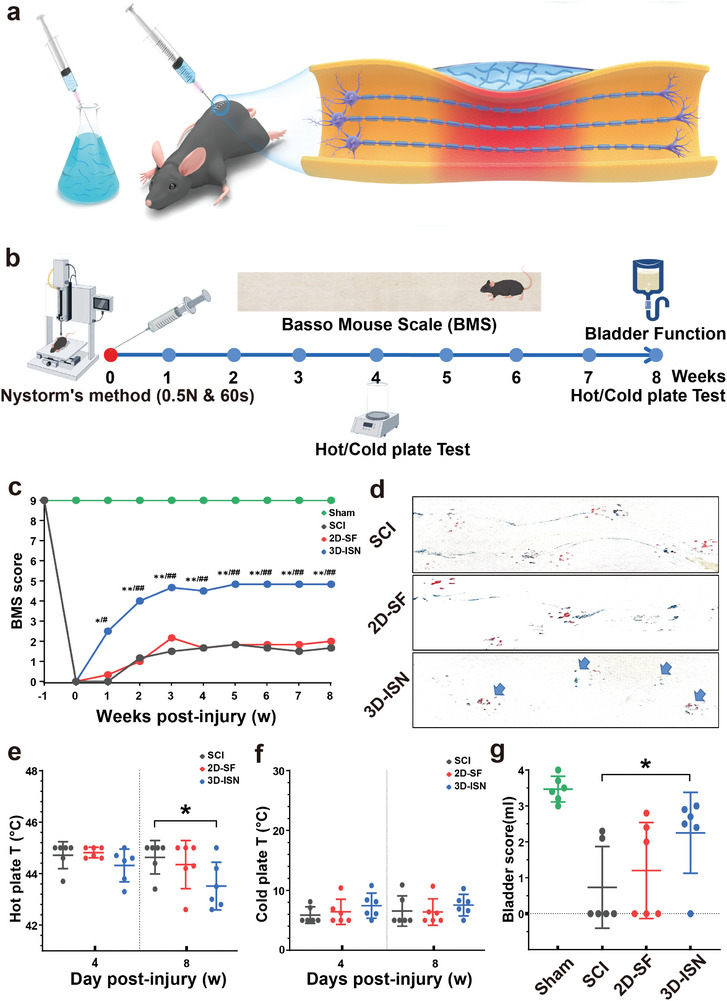
Figure 4.

The effects of 3D‐ISN on the behavior of mice after SCI. a) Schematic diagram of spinal cord compression injury in mice following orthotopic 3D‐ISN injection. b) Schematic diagram of the mouse model of spinal cord compression injury and the time point of behavioral scores. c) BMS score of mice with SCI after 3D‐ISN injection. d) Behavioral footprint test (56 days after injury; blue arrows point to hind limb fingerprints. e) Cold plate test at 4 and 8 weeks after SCI. f) Hot plate experiments in mice 4 and 8 weeks after injury. g) Bladder function scores (residual urine volume analysis) in mice 8 weeks after injury. (N = 6 in each group, p‐values are calculated using one‐way ANOVA, */# p < 0.05, **/## p < 0.01).
