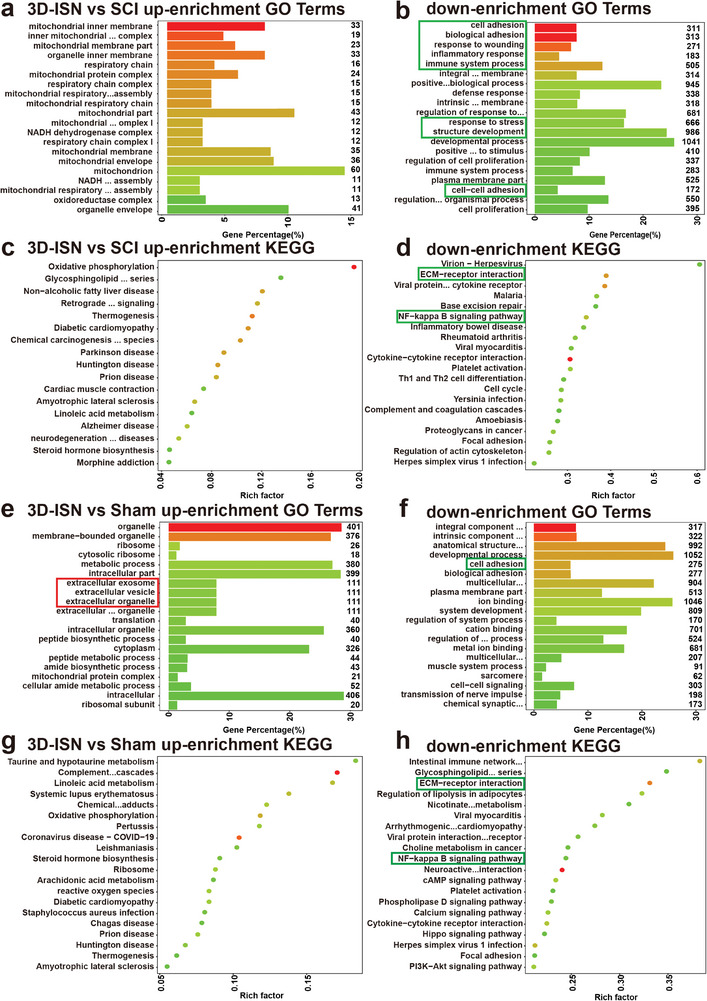
Figure 8.

GO and KEGG enrichment analysis of the Sham group, SCI group, and 3D‐ISN group. a,b) The top 20 up/down‐regulated GO terms of the 3D‐ISN group compared to the SCI group. c,d) The top 20 up/down‐regulated KEGG pathways of the 3D‐ISN group compared to the SCI group. e,f) The top 20 up/downregulated KEGG pathways of the 3D‐ISN group compared to the Sham group. g,h) The top 20 up/downregulated KEGG pathways of the 3D‐ISN group compared to the Sham group (N = 3 in each group).
