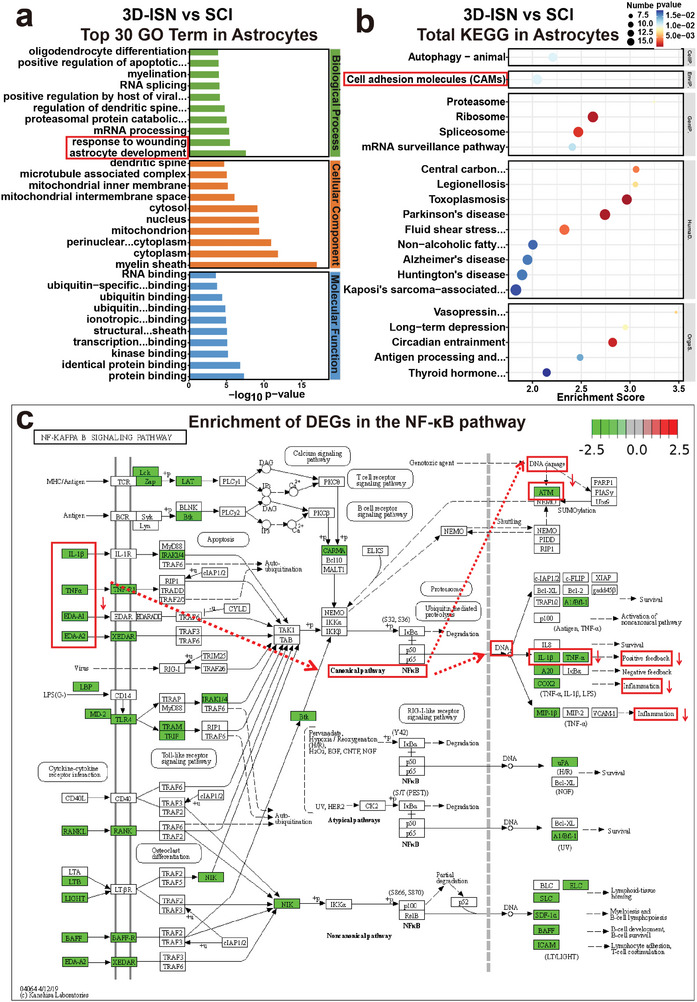
Figure 11.

GO and KEGG enrichment analysis of the 3D‐ISN group in astrocytes: a) Up/downregulated GO terms of the 3D‐ISN group compared to the SCI group. b) KEGG enrichment chart of the 3D‐ISN group compared to the SCI group. c) The enrichment of DEGs between the 3D‐ISN group and the SCI group in the NF‐κB signaling pathway (N = 3 in each group).
