
Figure 3.
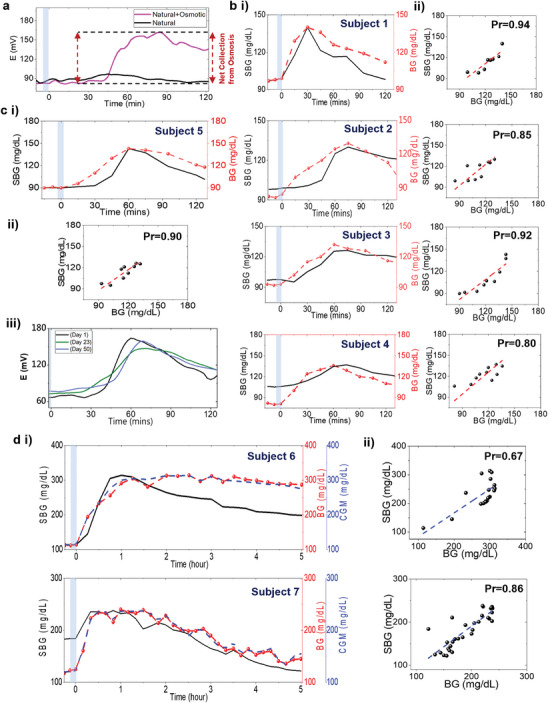
Sweat glucose trends from the fingertip. Comparative analysis of E(t) with and without the effect of osmosis after carbohydrate intake. b i Plots comparing the trends of SBG (t) versus BG (t) in four healthy subjects for 2 h after meal intake. The subjects fasted overnight before testing. ii Correlation plots between SBG (t) versus BG (t) for the same four subjects. c i Plot showing SBG (t) versus BG (t) trend, ii the correlation plot, and iii the stability of the glucose profile over ≈50 days for a subject. As SBG (t) showed an onset lag, repeated E (t) measurements were conducted on three different days (days 1, 23, and 50) with the same carbohydrate intake amount to check the E(t) profile stability. Similar E (t) versus t trends verified the subject‐specific occurrence of the sweat glucose profile. d Data from 2 diabetic subjects showing the i SBG (t) versus BG (t) trends and ii correlation plots after 5 h testing. The diabetic subjects fasted overnight before the test and took a prescribed fixed amount of insulin prior to meal consumption. Personalized parameters were evaluated from BG values. Similar SBG (t), BG(t), and CGM trends justify the model to be applicable to diabetic subjects as well. Blue zone: Meal intake duration.