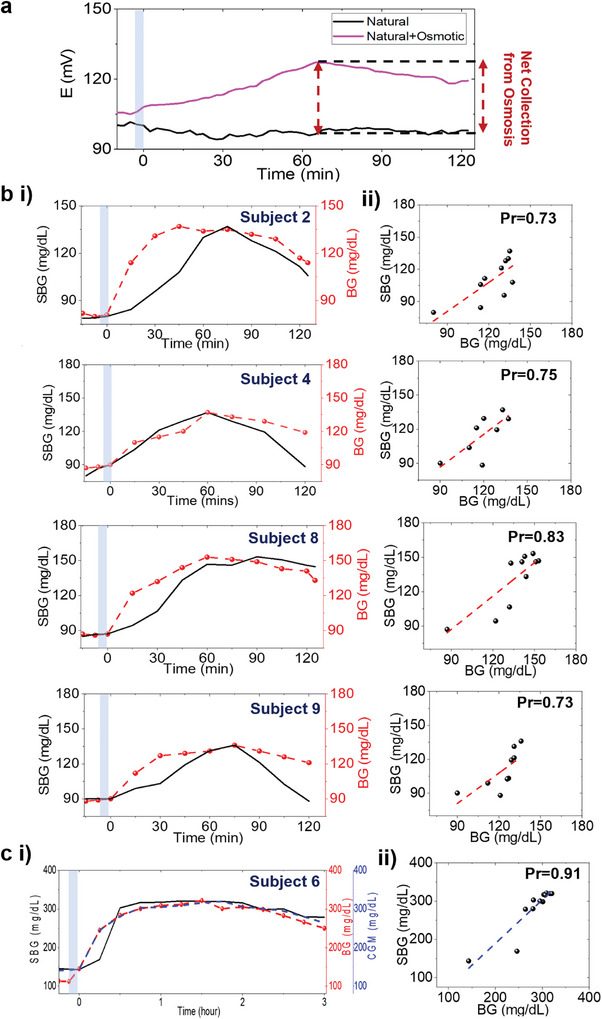
Figure 4.

Sweat glucose trends from the forearm. a Comparative analysis of E(t) with and without the effect of osmosis after carbohydrate intake. EG and PBS‐soaked hydrogels were used to track osmotic and non‐osmotic effects, respectively. b i Plots comparing the trends of SBG (t) versus BG (t) over for four healthy subjects after overnight fasting. ii Correlation plots between SBG (t) versus BG (t) for the same four subjects. c i Plot showing the SBG (t) versus BG (t) trend and ii their correlation for one diabetic subject. The same protocol as the fingertip test was followed by this diabetic subject. Personalized parameters were evaluated from BG values. Blue zone: Meal intake duration. Other conditions, as in Figure 3.
