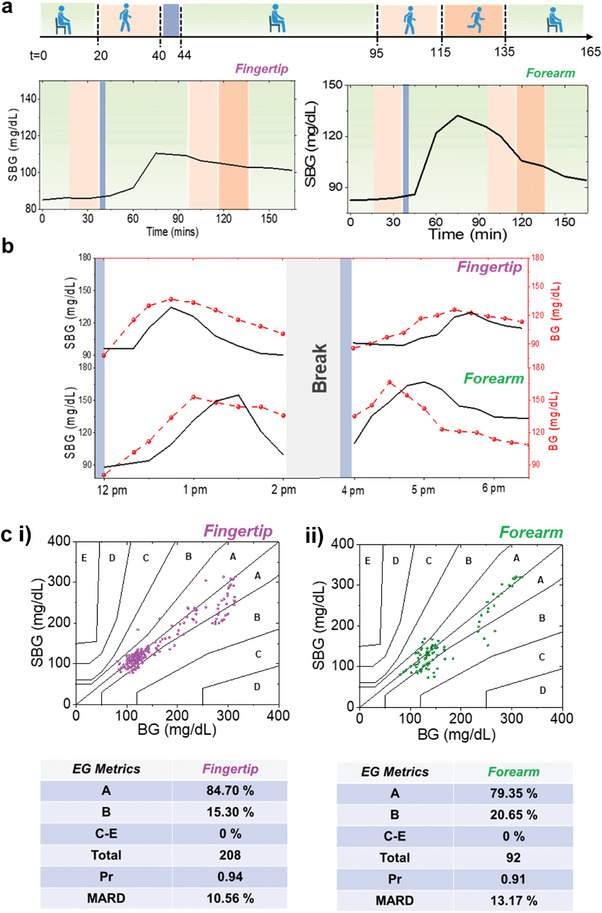
Figure 5.

Long‐term analysis of SCGM. a SBG(t) versus t profiles of subject 2 under varying physiological activities from fingertip and forearm during diverse daily activities: Green: Rest, Blue: Meal intake duration, Light red: Medium intensity walking, Dark red: High intensity walking. The subject had fasted overnight before testing. and were used as personalized parameters for fingertip and forearm, respectively. b SBG (t) versus t profiles for fingertip and forearm with multiple meals by wearing a single patch. During the break, the subject continuously wore the patch and did not perform any high exertion activity. c Consensus error grid plots and analysis from all data points obtained from the i fingertip and ii forearm trials.
