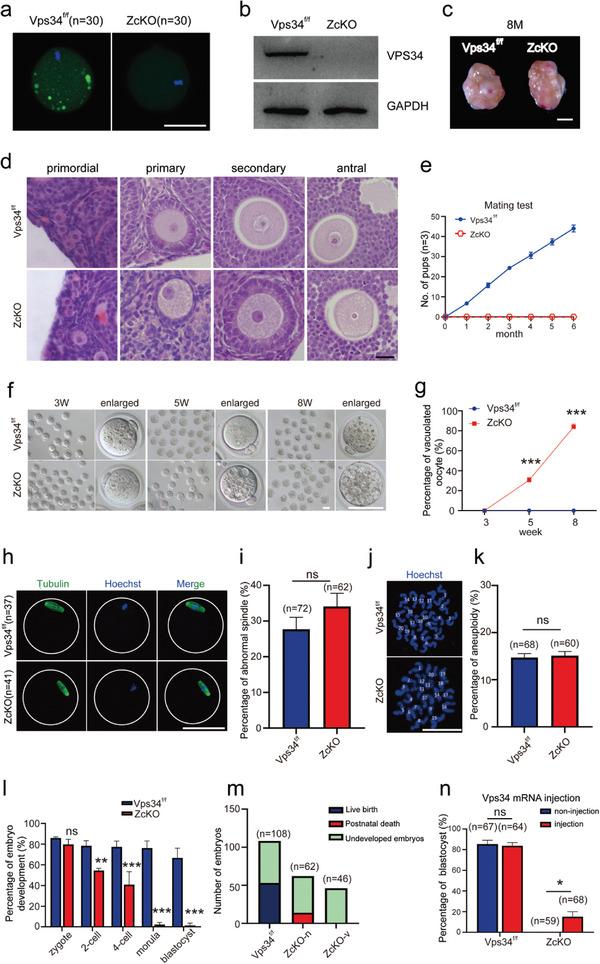
Figure 1.

Deletion of VPS34 in growing oocytes caused infertility due to defects on early embryonic development. a) Immunofluorescence of VPS34 in MII oocytes collected from 3 W control (Vps34f/f) and ZcKO mice. Scale bar = 50 µm. b) Western blot analysis of the expression of VPS34 in control and ZcKO MII oocytes. The expression of GAPDH was served as the internal control. c) Ovarian morphology of 8 M ZcKO mice compared with littermate control mice. Scale bar = 1 mm. d) Morphology of ovarian follicles at different developmental stages from 5 W control and ZcKO mice. Scale bar = 10 µm. e) Fertility curves of control and ZcKO mice after 6 months of mating. f,g) Increased vacuolation observed in ZcKO oocytes collected at 3, 5, and 8 W of age. Representative MII oocytes at various ages are presented (f), along with the percentage of vacuolated oocytes in each group (g). Scale bar = 50 µm. h) Immunofluorescence of Tubulin to label oocyte spindle in MII oocytes collected from control and ZcKO mice at 5 W of age. Green, Tubulin; blue, Hoechst 33342. Scale bar = 50 µm. i) Percentage of oocytes with abnormal spindles in control and ZcKO oocytes. j) Staining of the spread chromosome with Hoechst 33342 in mature oocytes. Scale bar = 50 µm. k) Aneuploidy assessment after chromosome counting. l) Percentage of early embryonic development in the two groups. Oocytes were collected from 5Wcontrol and ZcKO mice for IVF and early embryonic development was followed. m) Live birth after embryo transfer. The 2‐cell embryos derived from ZcKO oocytes were classified as vacuolated (ZcKO‐v) and non‐vacuolated (ZcKO‐n) embryos before being transferred into foster mother mice for development until birth. Embryos that did not result in live births were considered undeveloped, while pups that died immediately after birth were classified as postnatal deaths. n) The assessment of embryonic development after injection of Vps34 mRNA into control and ZcKO zygotes. At least 3 independent replicates were performed for each experiment. All graphs are presented as the means ± SEM. *p < 0.05, **p < 0.01, ***p < 0.001. ns = no significance.
