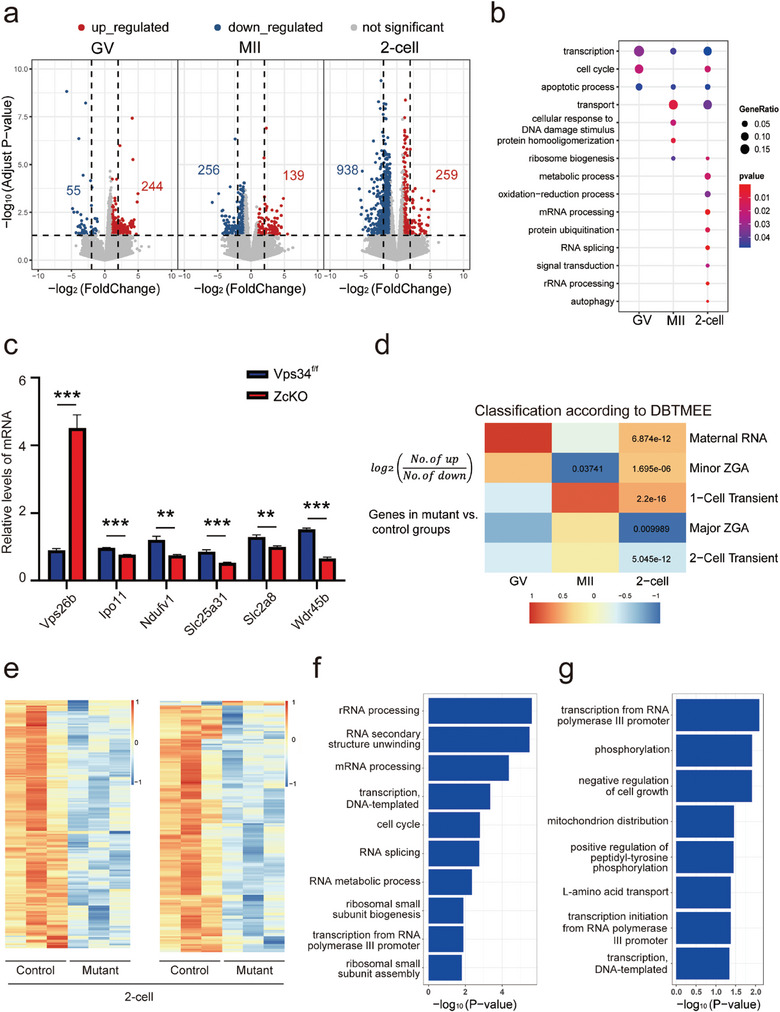
Figure 2.

Transcriptomic alterations in ZcKO oocytes and embryos. GV, MII, and 2‐cell embryos were collected from control and ZcKO mice at 5 W of age for single‐cell sequencing. a) Volcano plots of DEGs comparing the control and ZcKO groups. A number of upregulated and downregulated genes are represented separately in red and blue, respectively, with an absolute fold change > 2 and P‐value < 0.05. b) GO enrichment analysis of DEGs in GV, MII oocytes, and 2‐cell embryos. The size and color of dots represent the ratio of genes in the term and P‐value separately. c) Validation of DEGs enriched in transport and autophagy pathways by RT‐PCR on MII oocytes collected from control and ZcKO mice. At least 3 independent replicates were performed for each experiment. All graphs are presented as the means ± SEM. *p < 0.05, **p < 0.01, ***p < 0.001.d) Comparison of DEGs against a public database (DBTMEE) in which genes are categorized by specific expression patterns at any developmental stage. The Heatmap shows the log2 ratio of the number of upregulated genes to downregulated genes in the ZcKO group compared to the control group at GV, MII oocyte and 2‐cell embryo stages. Fisher's exact test performed with statistically significant P‐values labeled. e) The Heatmap of DEGs derived from 2‐cell embryos, showing overlap with the major ZGA cluster (left) and the 2‐cell transient activation cluster (right) in the DBTMEE database. f,g) GO enrichment analysis of DEGs overlapped in the major ZGA cluster (f) and the 2‐cell transient activation cluster (g). The size and color of dot represent the number of genes in the term and ‐log10 (P‐value) separately.
