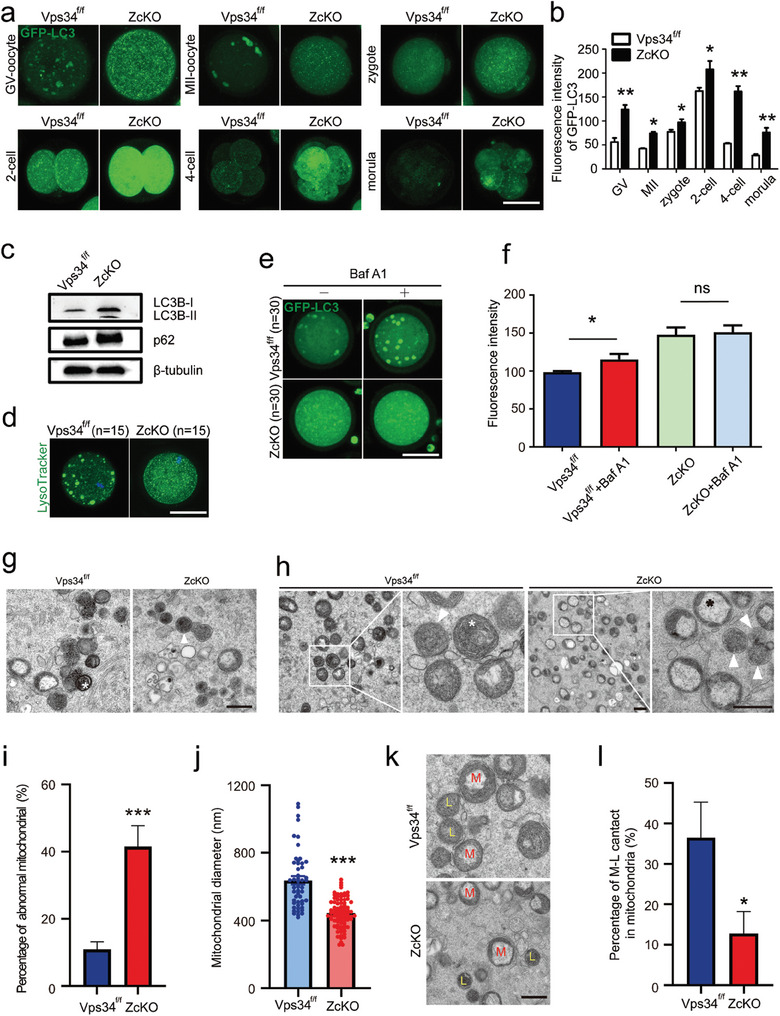
Figure 3.

Blockage of autophagic flux in ZcKO oocytes and early embryos. a) Immunofluorescence of GFP‐LC3 in oocytes and early embryos obtained from GFP‐LC3‐Vps34f/f (Vps34f/f) and GFP‐LC3‐ZcKO (ZcKO) mice. Oocytes were collected from GFP‐LC3‐Vps34f/f (Vps34f/f) and GFP‐LC3‐ZcKO (ZcKO) mice at 5 W of age for IVF. Early embryos at different developmental stages were then collected to observe autophagic flux and autophagy punctae (autophagosomes). Scale bar = 50 µm. b) Intensity of GFP‐LC3 fluorescence compared between GFP‐LC3‐Vps34f/f (Vps34f/f) and GFP‐LC3‐ZcKO (ZcKO) groups. c) Western blot of LC3B and p62 in control and ZcKO oocytes. β‐tubulin was used as an internal control. d) LysoTracker staining of oocytes collected from control and ZcKO mice. Scale bar = 50 µm. e) Fluorescence of LC3 GFP in GFP‐LC3‐Vps34f/f (Vps34f/f) and GFP‐LC3‐ZcKO (ZcKO) oocytes after treatment with autophagy inhibitor Baf‐A1 for 4 h. Scale bar = 50 µm. f) Fluorescent densities before/after Baf‐A1 treatment in each group of oocytes. g) Different lysosomal status in control and ZcKO oocytes observed by TEM. The white asterisk represents the formation of autolysosome with organelles in control oocytes, while white triangle indicates an unfused lysosome. Scale bar = 500 nm. h) Mitochondrial morphology in control and ZcKO oocytes under TEM. The right panel of each group displays a magnified view of the white frame shown in the left panel. White triangles, unfused lysosomes; white asterisk, normal mitochondria; black asterisk, damaged mitochondria. Scale bar on the left = 500 nm. Scale bar on the right = 200 nm. i) Percentage of abnormal mitochondria in control and ZcKO oocytes. j) Measurement of mitochondrial diameter in control and ZcKO oocytes by ImageJ software. k) Representative distributions of lysosomes and mitochondria in control and ZcKO oocytes. M, mitochondria; L, lysosomes. Scale bar = 500 nm. l) Quantification of mitochondria closely interacting with lysosomes in control and ZcKO oocytes. *p < 0.05, **p < 0.01, ***p < 0.001. ns = no significance.
