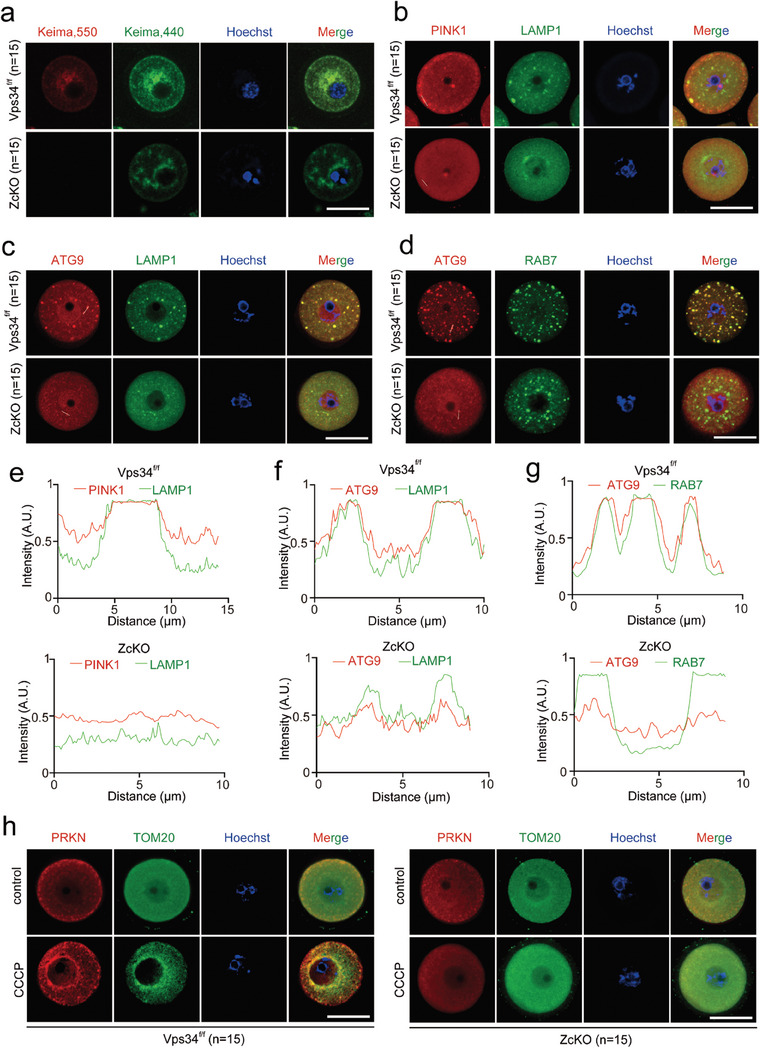
Figure 4.

Blockage of mitophagy flux in ZcKO Oocytes. GV oocytes were collected from 5 W control and ZcKO mice after PMSG treatment for 48 h. a) Mitophagy flux with mt‐Keima labeling. GV oocytes from control and ZcKO mice were micro injected with mt‐Keima mRNAs and hold in 2 µM milrinone for 8–10 h. Images of oocytes were collected at fluorescent emission 550 nm (red) and 440 nm (green), respectively. Red indicates active mitophagic flux, representing the fusion of mitophagosome with lysosome. Scale bar = 50 µm. b) Immunofluorescent co‐staining of PINK1 (red) and LAMP1 (green) in control and ZcKO oocytes. Scale bar = 50 µm. c) Immunofluorescent co‐staining of ATG9 (red) and LAMP1 (green) in control and ZcKO oocytes. Scale bar = 50 µm. d) Immunofluorescent co‐staining of ATG9 (red) and RAB7 (green) in control and ZcKO oocytes. Scale bar = 50 µm. e‐g) Intensity measurement of the lines shown inside the oocytes in Figure b‐d. h) Immunofluorescent co‐staining of PRKN (red) and TOM20 (green) in control and ZcKO oocytes. Oocytes were treated with or without 100 µM CCCP for 1 h. Scale bar = 50 µm. Blue, nuclear staining with Hoechst 33342; Merge, representing a superposition of fluorescence signals from three channels.
