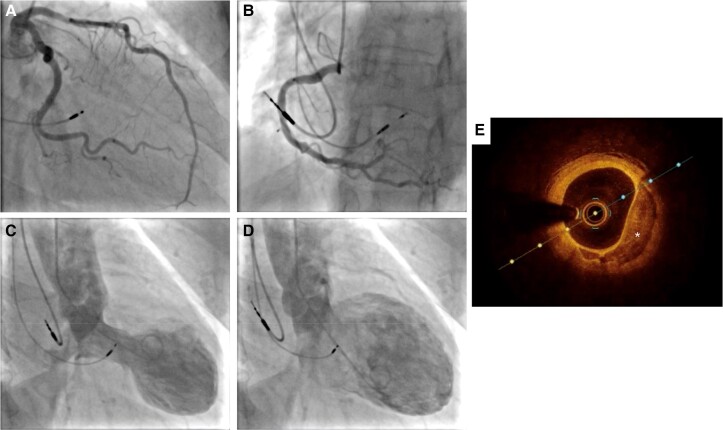
Figure 3.
Coronary angiography, ventriculography and optical coherence tomography (OCT) image of proximal part of left anterior descending artery performed after left bundle branch area pacing. (A, B) Left and right coronary angiography, respectively, showing unobstructed coronary arteries. (C, D) Left ventriculography during systole and diastole, showing typical apical left ventricular ballooning and basal hyperkinesia. (E) OCT image of proximal part of left anterior descending artery showing eccentric fibrocalcific plaque with thin endocardial cap (marked with *).

