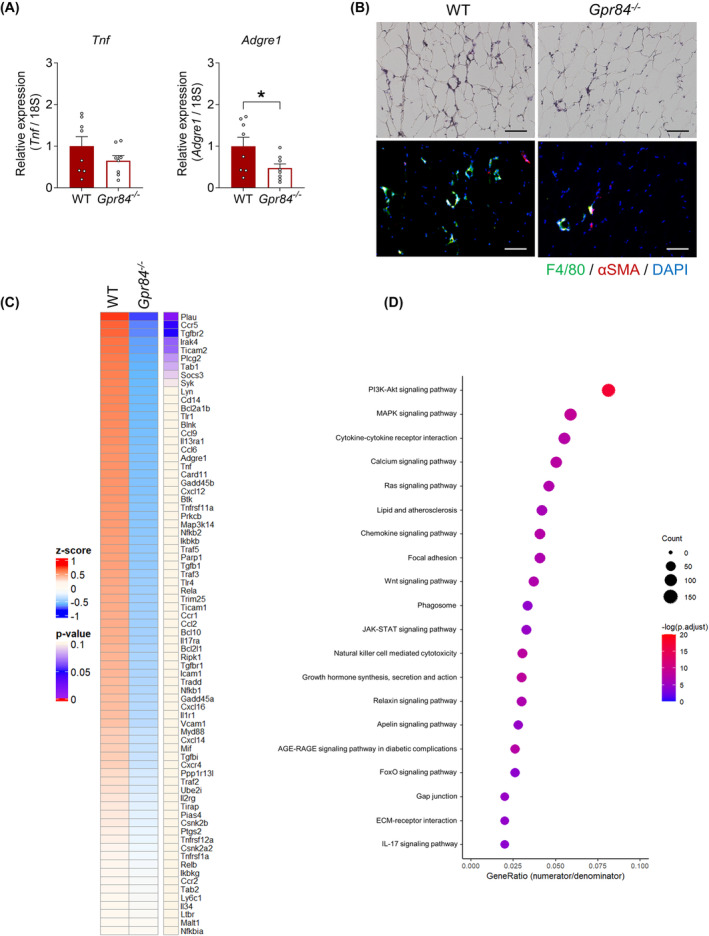
FIGURE 4.

Gpr84 −/− mice show improvement in inflammatory response under long‐term HFD feeding. (A) Tnf and Adgre1 mRNA expression in WAT (n = 8). (B) Inflammation level in WAT. Scale bar = 100 μm. (C) RNA‐Seq transcriptome profiling in WAT of WT and Gpr84 −/− mice fed the HFD for 12 weeks. Heatmap shows the results of two‐dimensional hierarchical clustering of 75 genes associated with inflammation (n = 4 per group). (D) Top 20 enriched Kyoto Encyclopedia of Genes and Genomes (KEGG) pathways of differentially expressed genes (DEGs). p‐values were adjusted for multiple testing using Bonferroni correction. *p < 0.05 (Student's t‐test: A). All data are presented as the mean ± SEM.
