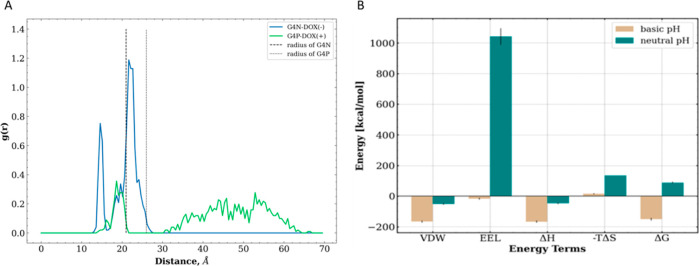
Figure 11.
(A) Radial distribution profiles were determined for the distances between the dendrimer and DOX molecules. The dashed vertical lines indicate the radii of the dendrimers; (B) binding free energy values ΔG and their decomposition terms for both systems [VDW—van der Waals (VDW) interaction energy, EEL—electrostatic interaction energy, ΔH—enthalpic contributions, and TΔS—entropy contribution].

