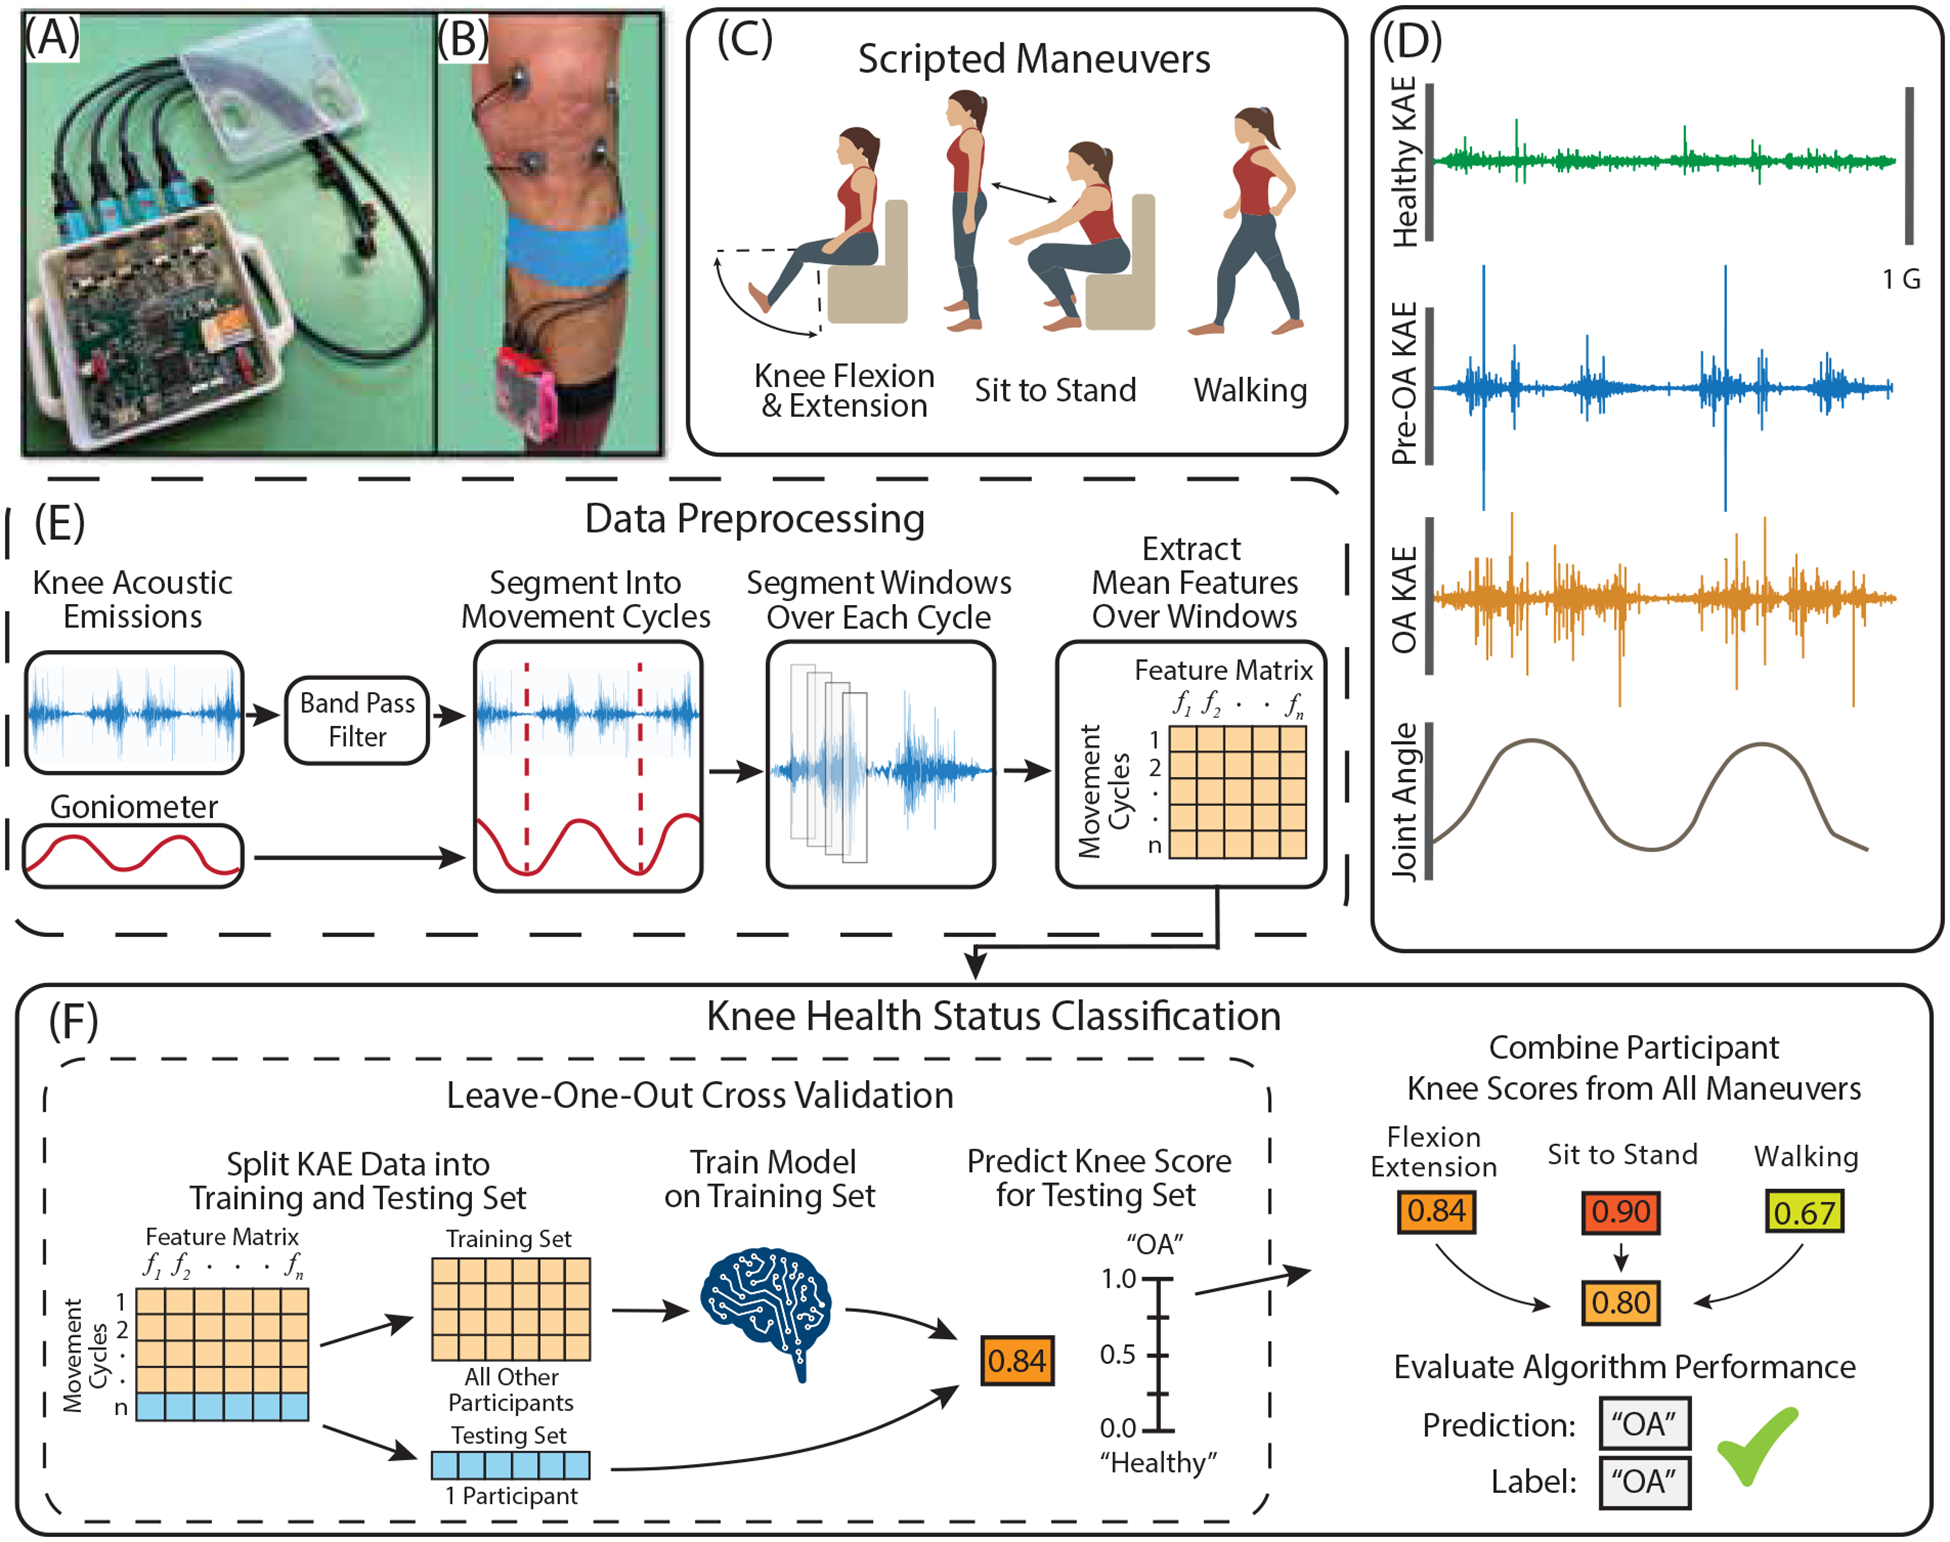
Fig. 1:

Illustration of hardware and acoustic data processing pipeline used in this study. (A) A custom printed circuit board designed by our group was integrated into a wearable form factor to record knee acoustic emissions. (B) The device was secured to the shin and microphones were attached to the knee with double sided adhesive and cables were secured with kinesiology tape. (C) Acoustic emissions were recorded from participants’ knees while they performed three scripted maneuvers. (D) Example acoustic emissions data during flexion extension from healthy, pre-OA, and OA knees with similar demographics (Male, age 37, BMI 24.0 – 25.0). (E) Acoustic data were filtered and segmented into cycles either using a dual-axis goniometer or locating peaks in the acoustic signal envelope. Cycles were further subdivided into 30 millisecond windows with 20 millisecond overlap. Spectral, temporal, Mel-cepstral and band power features were then extracted from each window and averaged across each cycle to be used in evaluating classification models (E). Logistic regression with leave-one-out cross-validation was used to derive a ‘Knee Score’ denoting the likelihood a participant’s knee was arthritic. Knee Scores were calculated for each scripted maneuver, and a composite Knee Score was calculated both by averaging scores across maneuvers as well as regressively weighting each
