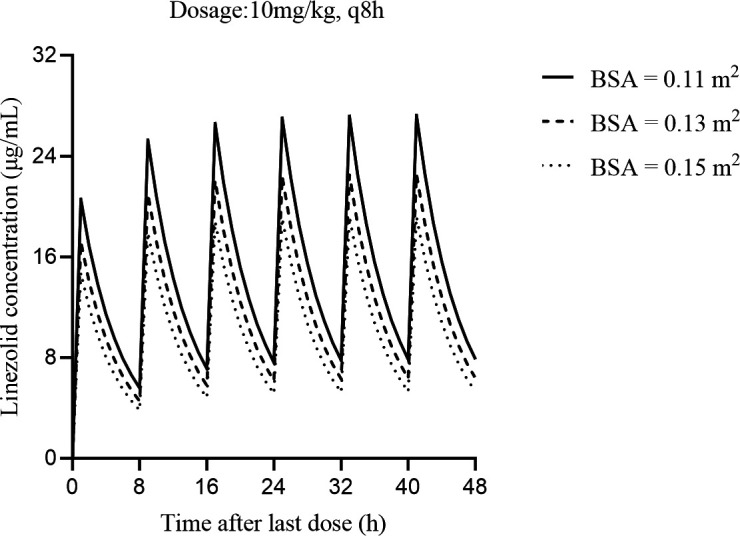
Fig 5.

Model-based prediction of linezolid concentrations versus time. Dosage regimen: 10 mg/kg, q8h; BSA = 0.11, 0.13, 0.15 m2.

Model-based prediction of linezolid concentrations versus time. Dosage regimen: 10 mg/kg, q8h; BSA = 0.11, 0.13, 0.15 m2.