
Fig. 4.
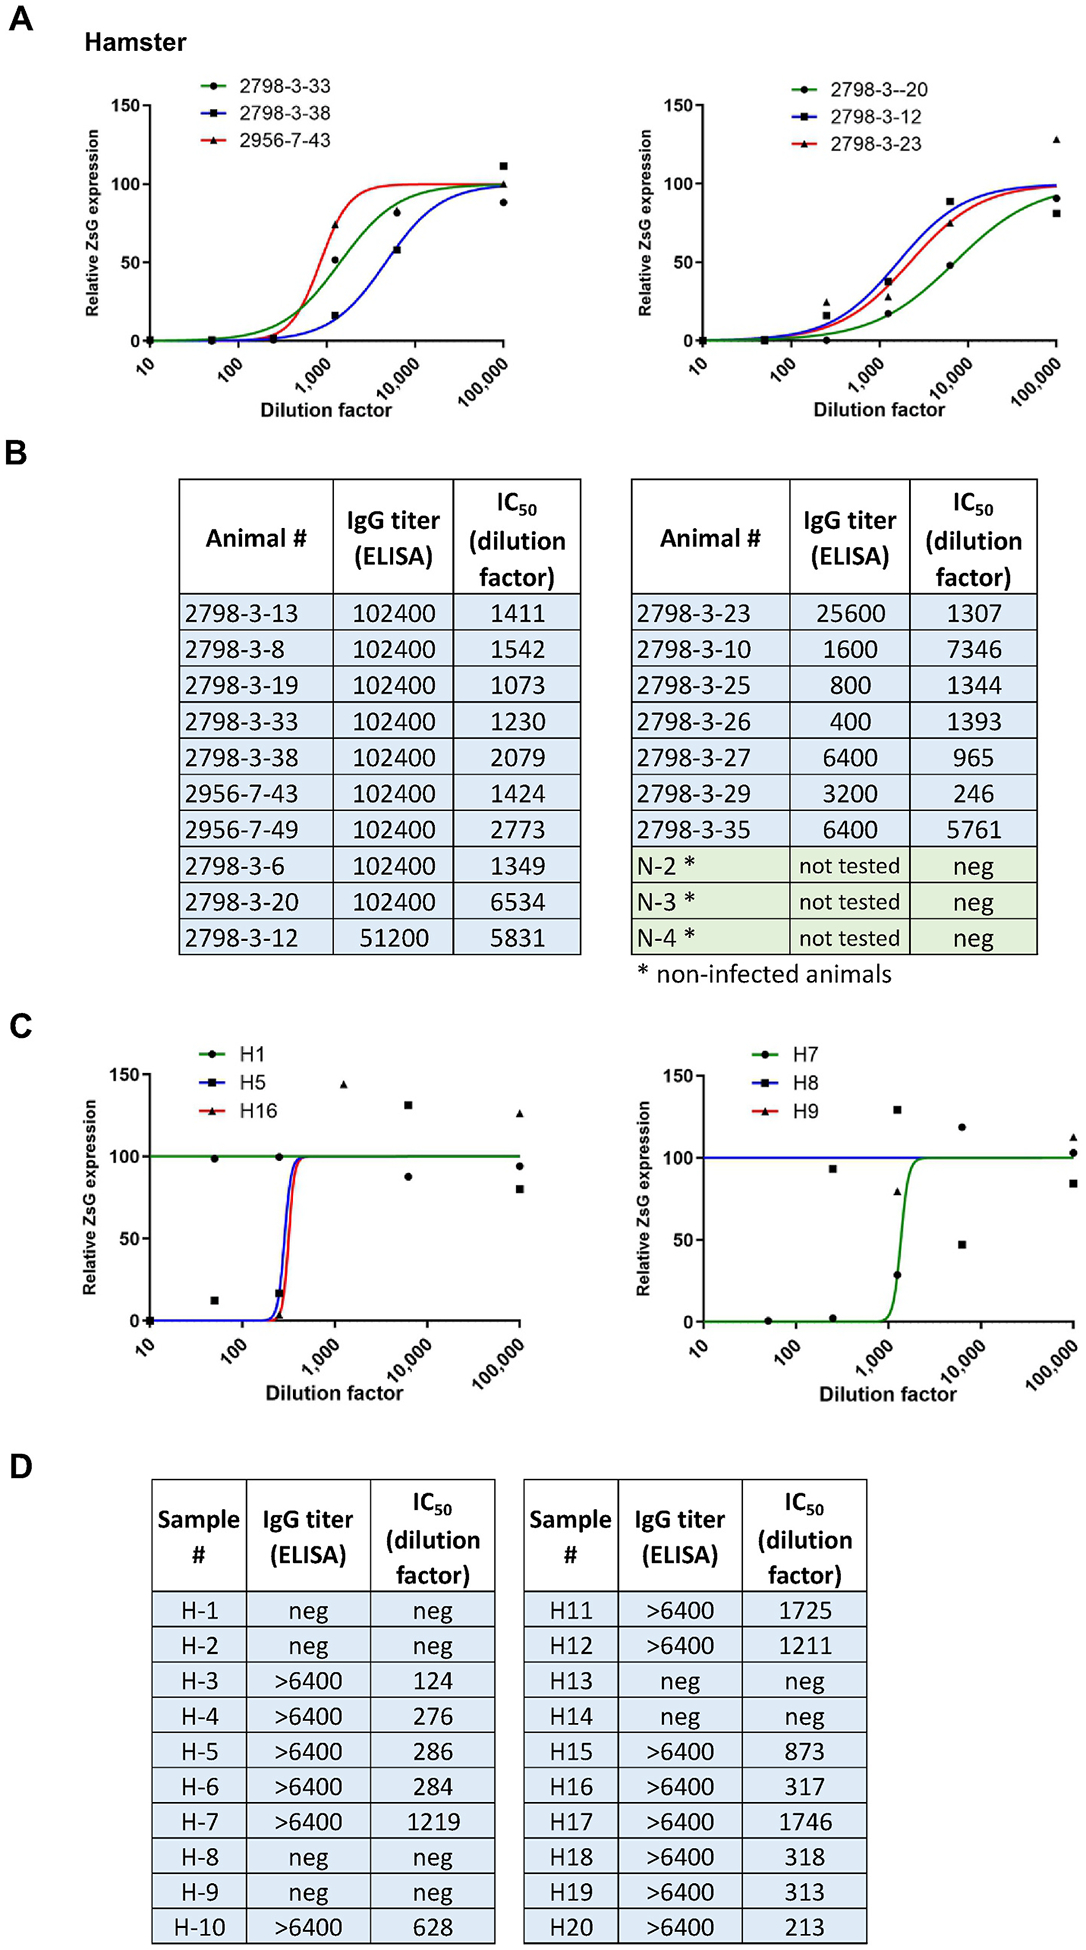
Neutralization assays using NiV-infected hamster plasma and human serum samples
A) Neutralization assays using rVSVΔG-NiV-G and plasma from infected hamsters: Vero-Fco cells were treated with serial 5-fold dilutions of different hamster serum samples mixed with 100 TCID50 of the recombinant virus. After 72 h, fluorescence signal was measured using Synergy (BioTek). The graphs show representative concentration-response curves in Vero-Fco cells infected with recombinant virus after neutralization with plasma samples obtained from hamsters infected with either NiV-M or NiV-M-ZsG, or uninfected (N). Each point on the graph represents mean and error bars indicate standard deviations of triplicate wells. N/A indicates negative for the assay. B) IC50 values of each hamster serum sample’s neutralization of rVSVΔG-NiV-G along with IgG ELISA titer values. C) Neutralization assays using rVSVΔG-NiV-G and human serum: Vero-Fco cells were treated with serial 5-fold dilutions of different human serum samples mixed with 100 TCID50 of the recombinant virus. After 72 h, fluorescence signal was measured using Synergy (BioTek). Figure shows concentration-response curves in Vero-Fco cells infected with recombinant virus after neutralization with human serum samples. Each point on the graph represents the mean and error bars indicate standard deviations of triplicate wells. D) IC50 values of each human sample’s neutralization of rVSVΔG-NiV-G along with IgG ELISA titer values.