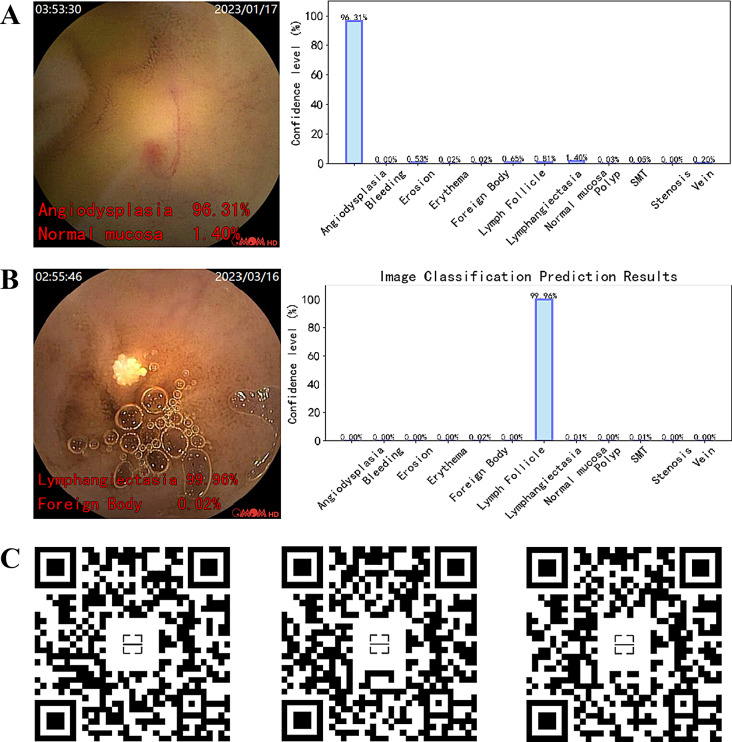
Fig. 10.
Prediction Results of the Model on Single Frame Images and Video after Deployment. (A) & (B) Prediction of the model on single-frame CE images, with the original image on the left, where the red font in the bottom left corner displays the model’s prediction for the top two categories and their corresponding confidence levels. Correspondingly, the image on the right shows a histogram representation of the confidence levels for each category. (C) The real-time prediction effect of the model on video, displaying predictions for 3 different categories of small intestinal lesions

