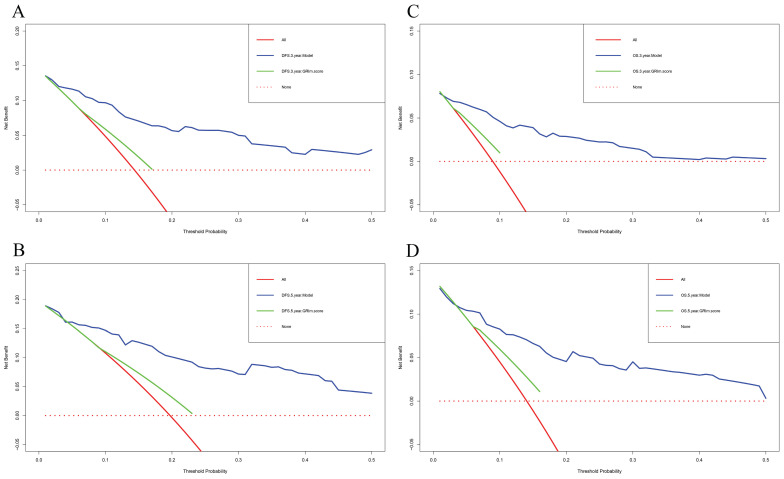
Figure 4.
Decision curve analyses (DCA) of nomogram and GRIm score prediction model for predicting the DFS and OS rates in 3- and 5-year. A) DCA of nomogram and GRIm score prediction model for predicting the DFS rates in 3-year; B) DCA of nomogram and GRIm score prediction model for predicting the DFS rates in 5-year; C) DCA of nomogram and GRIm score prediction model for predicting the OS rates in 3-year; D) DCA of nomogram and GRIm score prediction model for predicting the OS rates in 5-year.

