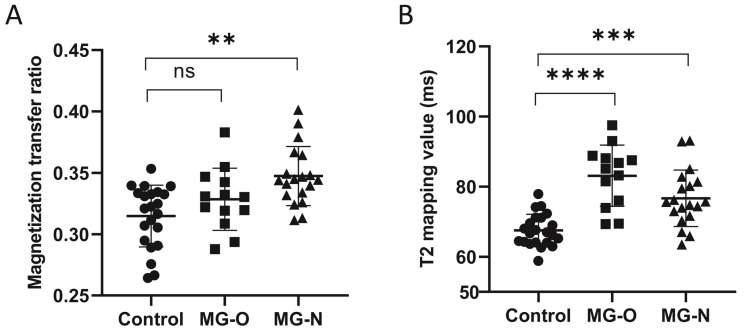
Figure 2.
Comparison of the magnetization transfer ratio (MTR) (A) and the T2-mapping values (B) in healthy controls, myasthenia gravis (MG) patients with ophthalmoparesis (MG-O group), and MG patients without ophthalmoparesis (MG-N group). ns, not significant. **, p < 0.01; ***, p < 0.001; ****, p < 0.0001.

