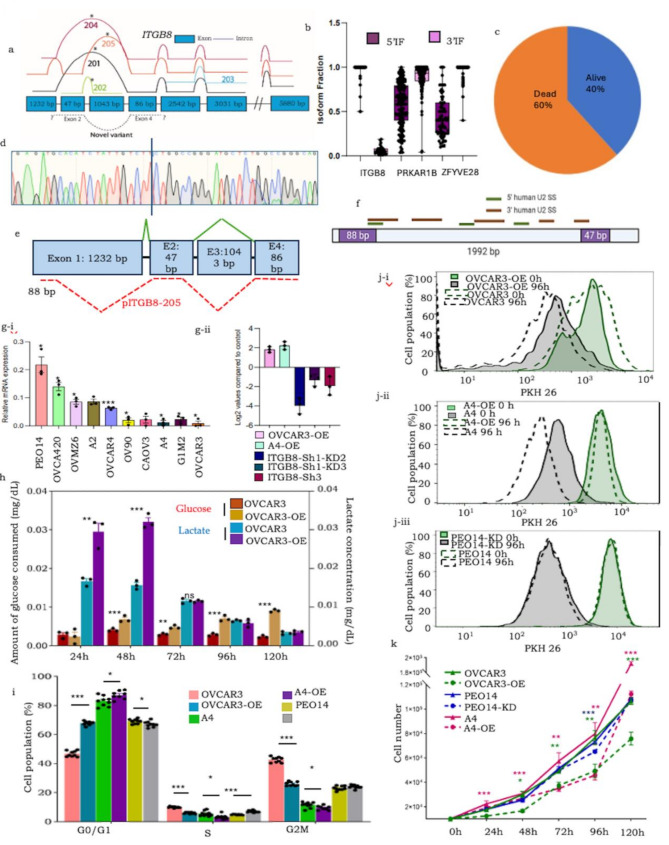
Fig. 1.
(a) ITGB8 splice graph positioning known variants and novel reads (denoted as dashed lines above and below exons, respectively); (b) Box and whisker plot representing isoform fractions of the alternative continuum of exons in the new variants; (c) pie chart showing the distribution of the number of dead and living patients expressing pITGB8-205; (d) Sanger sequencing-based validation of 133 bp ITGB8 (Exons 2, 4); (e) Novel 5’ pITGB8-205 sequences; (f) Predicted major U2-mediated spliceosome sites in pITGB8-205; (g.i) Overexpression of pITGB8-205 affects cell growth, cycling and metabolism. (a) Profiling of pITGB8-205 full length (2.4 kb) in 10 HGSC cell lines (X-axis indicates the HGSC cell lines, Y-Axis indicates the relative pITGB8-205 FL expression compared with the endogenous control; (g.ii) Screening of pITGB8-205 overexpressing (OVCAR3-OE, A4-OE) and knockdown (PEO14-KD) clones; (h) Bar graph representation of glucose consumption and lactate production (mg/dL; normalized with cell number) of OVCAR3-OE and control cells at 24, 48, 72, 96 and 120 h in culture; (i) Bar graph representing the cell cycle phases in OVCAR3-OE, A4-OE and PEO14-KD vs. control cells; (j) Histogram representing differential label quenching (cell cycling) dynamics of i-OVCAR3-OE, ii-A4-OE and iii-PEO14-KD vs. control cells (Solid lines- OVCAR3-OE/A4-OE/PEO14-KD, Dotted lines - respective controls at 0 (Green) and 96 h (black); (k) Representative doubling times of OVCAR3-OE, A4-OE and PEO14

