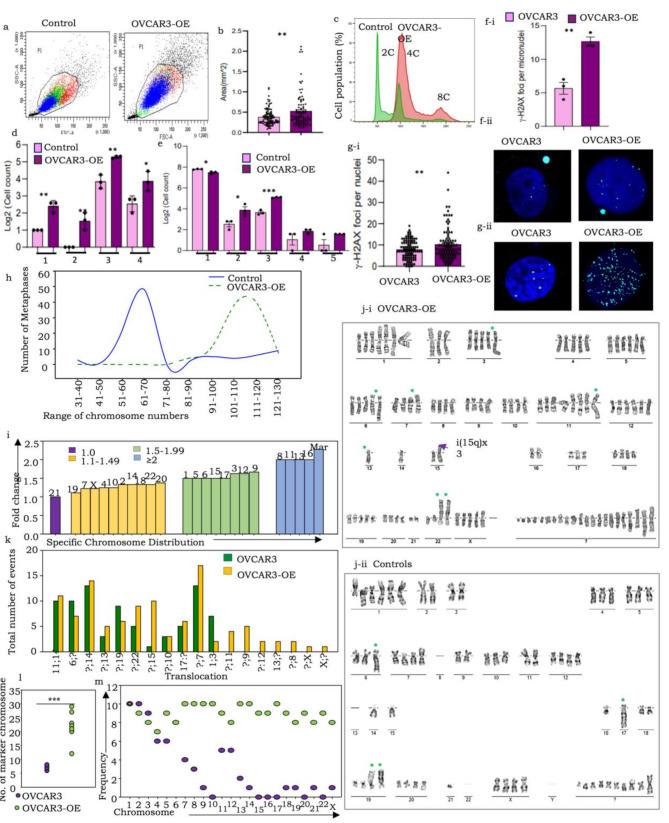
Fig. 2.
pITGB8-205 overexpression in OVACR3-OE cells triggers genomic and chromosomal instability, altered ploidy, extensive DNA damage, aneuploidy and near-whole-genome duplication. A FACS dot plot comparing cell size and granularity in OVCAR3-OE (right) with control (left) cells; (b) Bar graph comparing the cell area (mm2) of OVCAR3-OE with the respective control cells; (c) Representative FACS histogram comparing the DNA content of OVCAR3-OE with control cells (upper and lower panels, respectively); (d) Bar graph representation of quantified nuclear and chromosomal anomalies (1-lagging chromosomes, 2-anaphase bridges, 3-multinucleated cells, 4-micronuclei); (e) Bar graph representation of increased micronuclei (1), mononucleated (2), binucleate (3), trinucleate (4), and tetranucleated (5) cells in OVACR3-OE over control cells; (f-i) Graphical representation of the percentage of γ-H2AX-positive nuclei and micronuclei in OVCAR3-OE and control cell nuclei, (f-ii) Representative immunofluorescence images of phosphorylated H2AX expression in OVCAR3-OE and control cell nuclei, γ-H2AX (cyan) and nuclei (DAPI); (g-i) Graph indicating the number of γ-H2AX foci per nucleus in OVCAR3-OE vs. control cells, (g-ii) Representative immunofluorescence images of phosphorylated H2AX foci in PEO14-KD vs. control; (h) Comparison of the range of chromosome numbers in OVCAR3-OE and control cells (100 metaphases screened for each); (i) Bar graph representation of the fold change in individual chromosome copy numbers; (j) Representative karyotypes of (i) OVCAR3-OE cells and (ii) Controls; (k) Bar graph representation of translocation events; (l) Dot plot comparing several marker chromosomes in control and OVCAR3-OE cells; (m) Frequency (number of metaphases) harboring specific chromosomes in the marker fraction resolved by Ikaros 6.3

