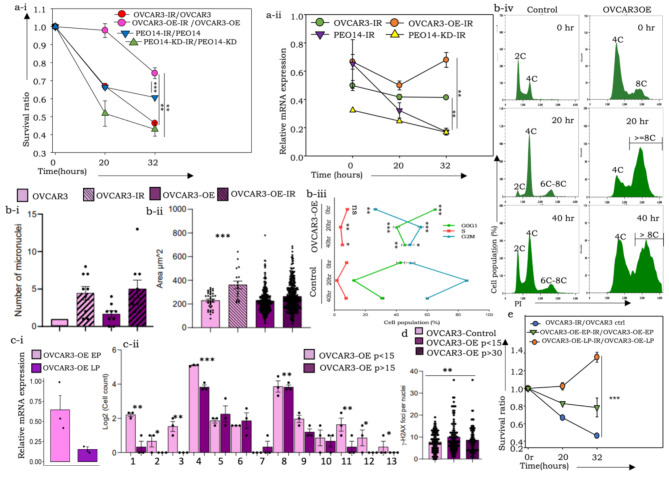
Fig. 3.
Effects of g-irradiation on pITGB8-205 derivative cells and their controls. (a-i) Ratios of surviving cells (irradiated: unirradiated OVCAR3 controls), (irradiated: unirradiated OVCAR3-OE), cells (irradiated: unirradiated PEO14 controls), (irradiated: unirradiated PEO14-KD); (a-ii) Relative expression of pITGB8-205 (vis-à-vis 133 bp of Exons 2 and 4) in postirradiation surviving cells at specific time points; (b-i) Box and whisker plot representation of micronuclei-containing cells in unirradiated and irradiated OVCAR3-OE and control cells as revealed through a cytokinesis-block micronucleus cytome assay; (b-ii) Bar graph showing increased nuclear size in the same cell groups; (b-iii) Line graph indicating the cell cycle perturbation in OVCAR3-OE vs. control cells after irradiation; (b-iv) Histogram representing the altered ploidy in OVCAR3-OE vs. control cells after 0 h, 20 h and 40 h (from top to bottom) after irradiation (blue– OVCAR3 control, green– OVCAR3-OE); (c) Graphical representation of reduced (i) relative mRNA expression of pITGB8-205, (ii) nuclear and chromosomal instabilities in early- and late-passage OVCAR3-OE cells; misaligned metaphases (1), lagging chromosomes (2), anaphase bridges (3), binucleated (4), trinucleated (5), tetranucleated (6), hexanucleated (7), micronuclei (8), lobed nuclei (9), blebbed nuclei (10), notched nuclei (11), ring nuclei (12), cytokinesis defects (13); (d) Bar graph representation γ-H2AX foci in OVCAR3-OE early and late passages (p < 15 and p > 30, respectively) vs. controls; e. Ratios of surviving cells (irradiated: unirradiated OVCAR3 controls) (irradiated: unirradiated OVCAR3-OE-EP) (irradiated: unirradiated OVCAR3-OE-LP)

