Fig. 4.
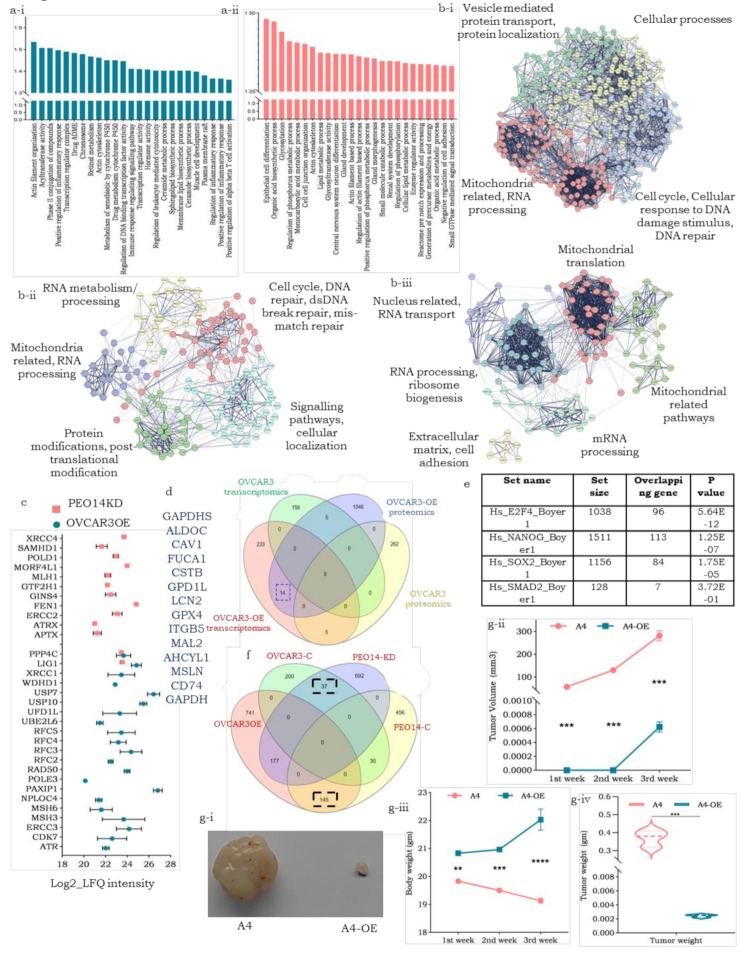
Molecular pathway perturbations driven by pITGB8-205; (a) Bar graph representing GSEA-enriched gene sets in the transcriptomics data of a-i. OVCAR3-OE and a-ii. PEO14-KD cells; (b) STRING protein interaction network of exclusive proteins in b-i. OVCAR3-OE, b-ii. PEO14KD and b-iii A4-OE; (c) Dot plot of enriched proteins for the cellular response to DNA damage stimulus and DNA damage repair in OVCAR3-OE and PEO14-KD; (d) Venn diagram representing the overlap between enriched transcripts and proteins (n = 14), in OVCAR3OE over control, from transcriptomics and proteomics data; (e) The table represents the overlap between OVCAR3-OE enriched proteins with the gene targets of different transcription factors (TFs); (f) Venn diagram representing the overlapping proteins enriched in OE and KD derivatives and their respective controls. (g-i) A4 control vs. A4-OE tumor images harvested on the 36th day after cell injection; (g-ii) Line plot indicating the A4-OE and A4 control tumor volumes at different time intervals (1st week after tumor palpation); (g-ii) Line plot representing the body weights of the mice at the indicated time intervals; (g-iv) Violin plot representing the weight of the harvested tumors

