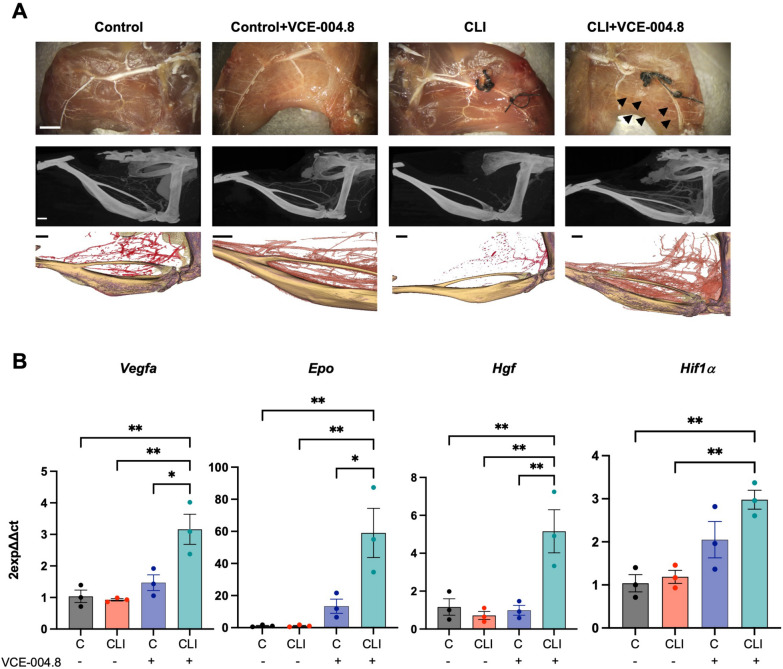
Fig. 7.
Effects of oral VCE-004.8 in a Critical Limb Ischemia mouse model. A Representative whole-mount images of Microfil vascular cast limbs 10 days after ischemia (upper panel) (Scale bar 2 mm), µ-CT reconstruction, and their segmentation of arterial vasculature 28 days (middle and lower panel) (Scale bar 1 mm) after femoral artery ligation. Collateral artery growth is indicated by black arrows. B Expression of Vegf-a, Epo, Hgf, and Hif1α mRNA in the gastrocnemius after 10 days of ischemia. The data passed the normality test performed by the Shapiro–Wilk test. P value is calculated using 1-way ANOVA followed by Tukey post hoc multiple comparisons to compare between the groups (n = 3 animals per group). The results are shown as means ± SEM. P value indicated in panel, significant as *p < 0.05, **p < 0.01

