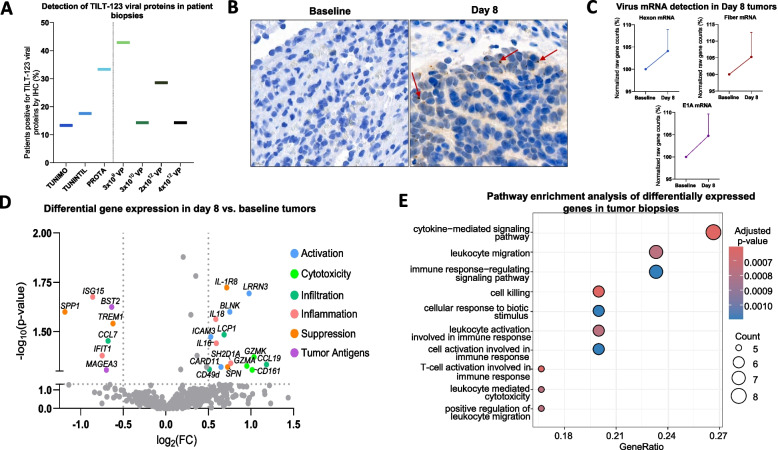
Fig. 3.
Detection of viral proteins and transcriptomic changes in biopsies. A Percentage of patients positive for viral proteins (E1A or hexon) in day 8 biopsies detected by IHC, per trial and by dose received. B IHC image of day 8 spleen biopsy from an epithelial ovarian cancer patient 30210. Red arrows highlighting speckled brown diaminobenzidine (DAB) stain indicating the presence of hexon. C Normalized gene counts of viral mRNA (hexon, fiber, and E1A) in baseline and day 8 biopsies detected using Nanostring nCounter® gene expression analysis. Nanostring analysis was performed on 14 tumor biopsies, including 9 biopsies from patients in the TUNIMO trial and 5 biopsies from patients in the PROTA trial. Data presented as mean ± SEM. D Volcano plot of differentially expressed genes analyzed by Nanostring nCounter® in day 8 biopsies compared to baseline biopsies, grouped by immunological function. Grey dots indicate genes which do not pass threshold values of –log10(p-value) > 1.3 and log2(FC) > 0.5 or < -0.5. Statistical differences between groups were assessed using either t-tests or Mann–Whitney U tests, where non-significant results were p > 0.05. E Pathway enrichment analysis of differentially expressed genes (DEGs) in day 8 biopsies

