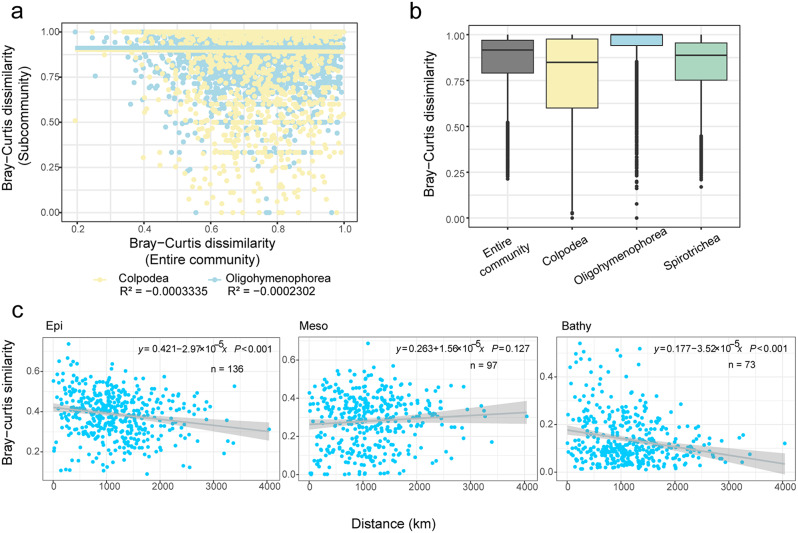
Fig. 3.
Ciliate community dissimilarity and distance-decay pattern. (a) Relationship between the entire ciliate community and the Oligohymenophorea as well as Colpodea subcommunities, considering all water layers. (b) Bray-Curtis dissimilarity boxplot of the entire ciliate community and subcommunities considering all layers. (c) Relationships between the horizontal community similarity and oceanic distance among pairwise stations in Epi (Epipelagic zone, 5 m – DCM), Meso (Mesopelgaic zone, 200 m – 1,000 m) and Bathy (Bathypelagic zone, 2,000 m – bottom). The points show the community similarity values for each distance unit considering all pairwise stations. The relationship between community similarity and oceanic distance is fitted by a linear model (solid line). The smooth shadows represent the 95% confidence level intervals for the predictions of a linear model. A similarity value of 0 indicates that the two stations have no ASV in common, while a value of 1 indicates the two stations have identical communities. n indicates the number of stations. The significance level (P value) is displayed for each of the linear regressions

